Renewable Energy Trends, Edition 3: Site Selection for Solar
Executive Summary
The solar development landscape is constantly evolving. For the first time in over a year, we’re seeing an increase in hosting capacity and a rebound in suitable site availability in several key states. While many regions continue to face challenges related to land availability and grid constraints, this shift suggests that new opportunities are emerging. Developers equipped with dynamic, site-level data are best positioned to act on them quickly.
Methodology
This report analyzes siting data from January 2024 through April 2025, with projections extending through October 2025. The analysis focuses on three key variables:
- Number of suitable sites: Defined as parcels with +1 MW of feeder capacity and +15 buildable acres.
- Average site size (acres)
- Available feeder capacity (MWs per site)
States analyzed include Colorado, Connecticut, Delaware, Illinois, Michigan, Minnesota, New York, Oregon, Virginia, and Washington, providing a diverse view of renewable energy site availability across the United States.
Key Trends and Findings
Suitable Site Availability Stabilizing
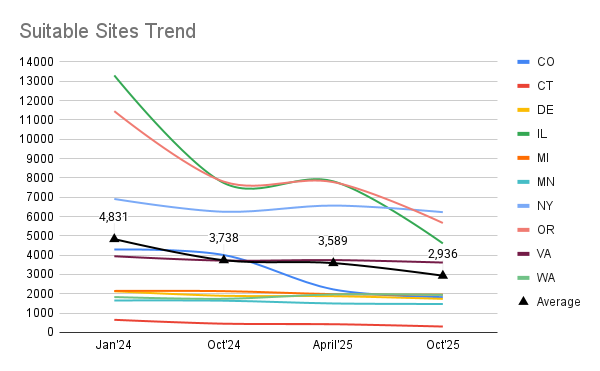
Across the states analyzed, most continue to see a decline in the number of suitable sites, but that trend is no longer universal. Several states, including New York, Illinois, Virginia, and Washington, show signs of stabilization or growth, indicating that site availability may be beginning to rebound in select submarkets.
Here’s how each state compares:
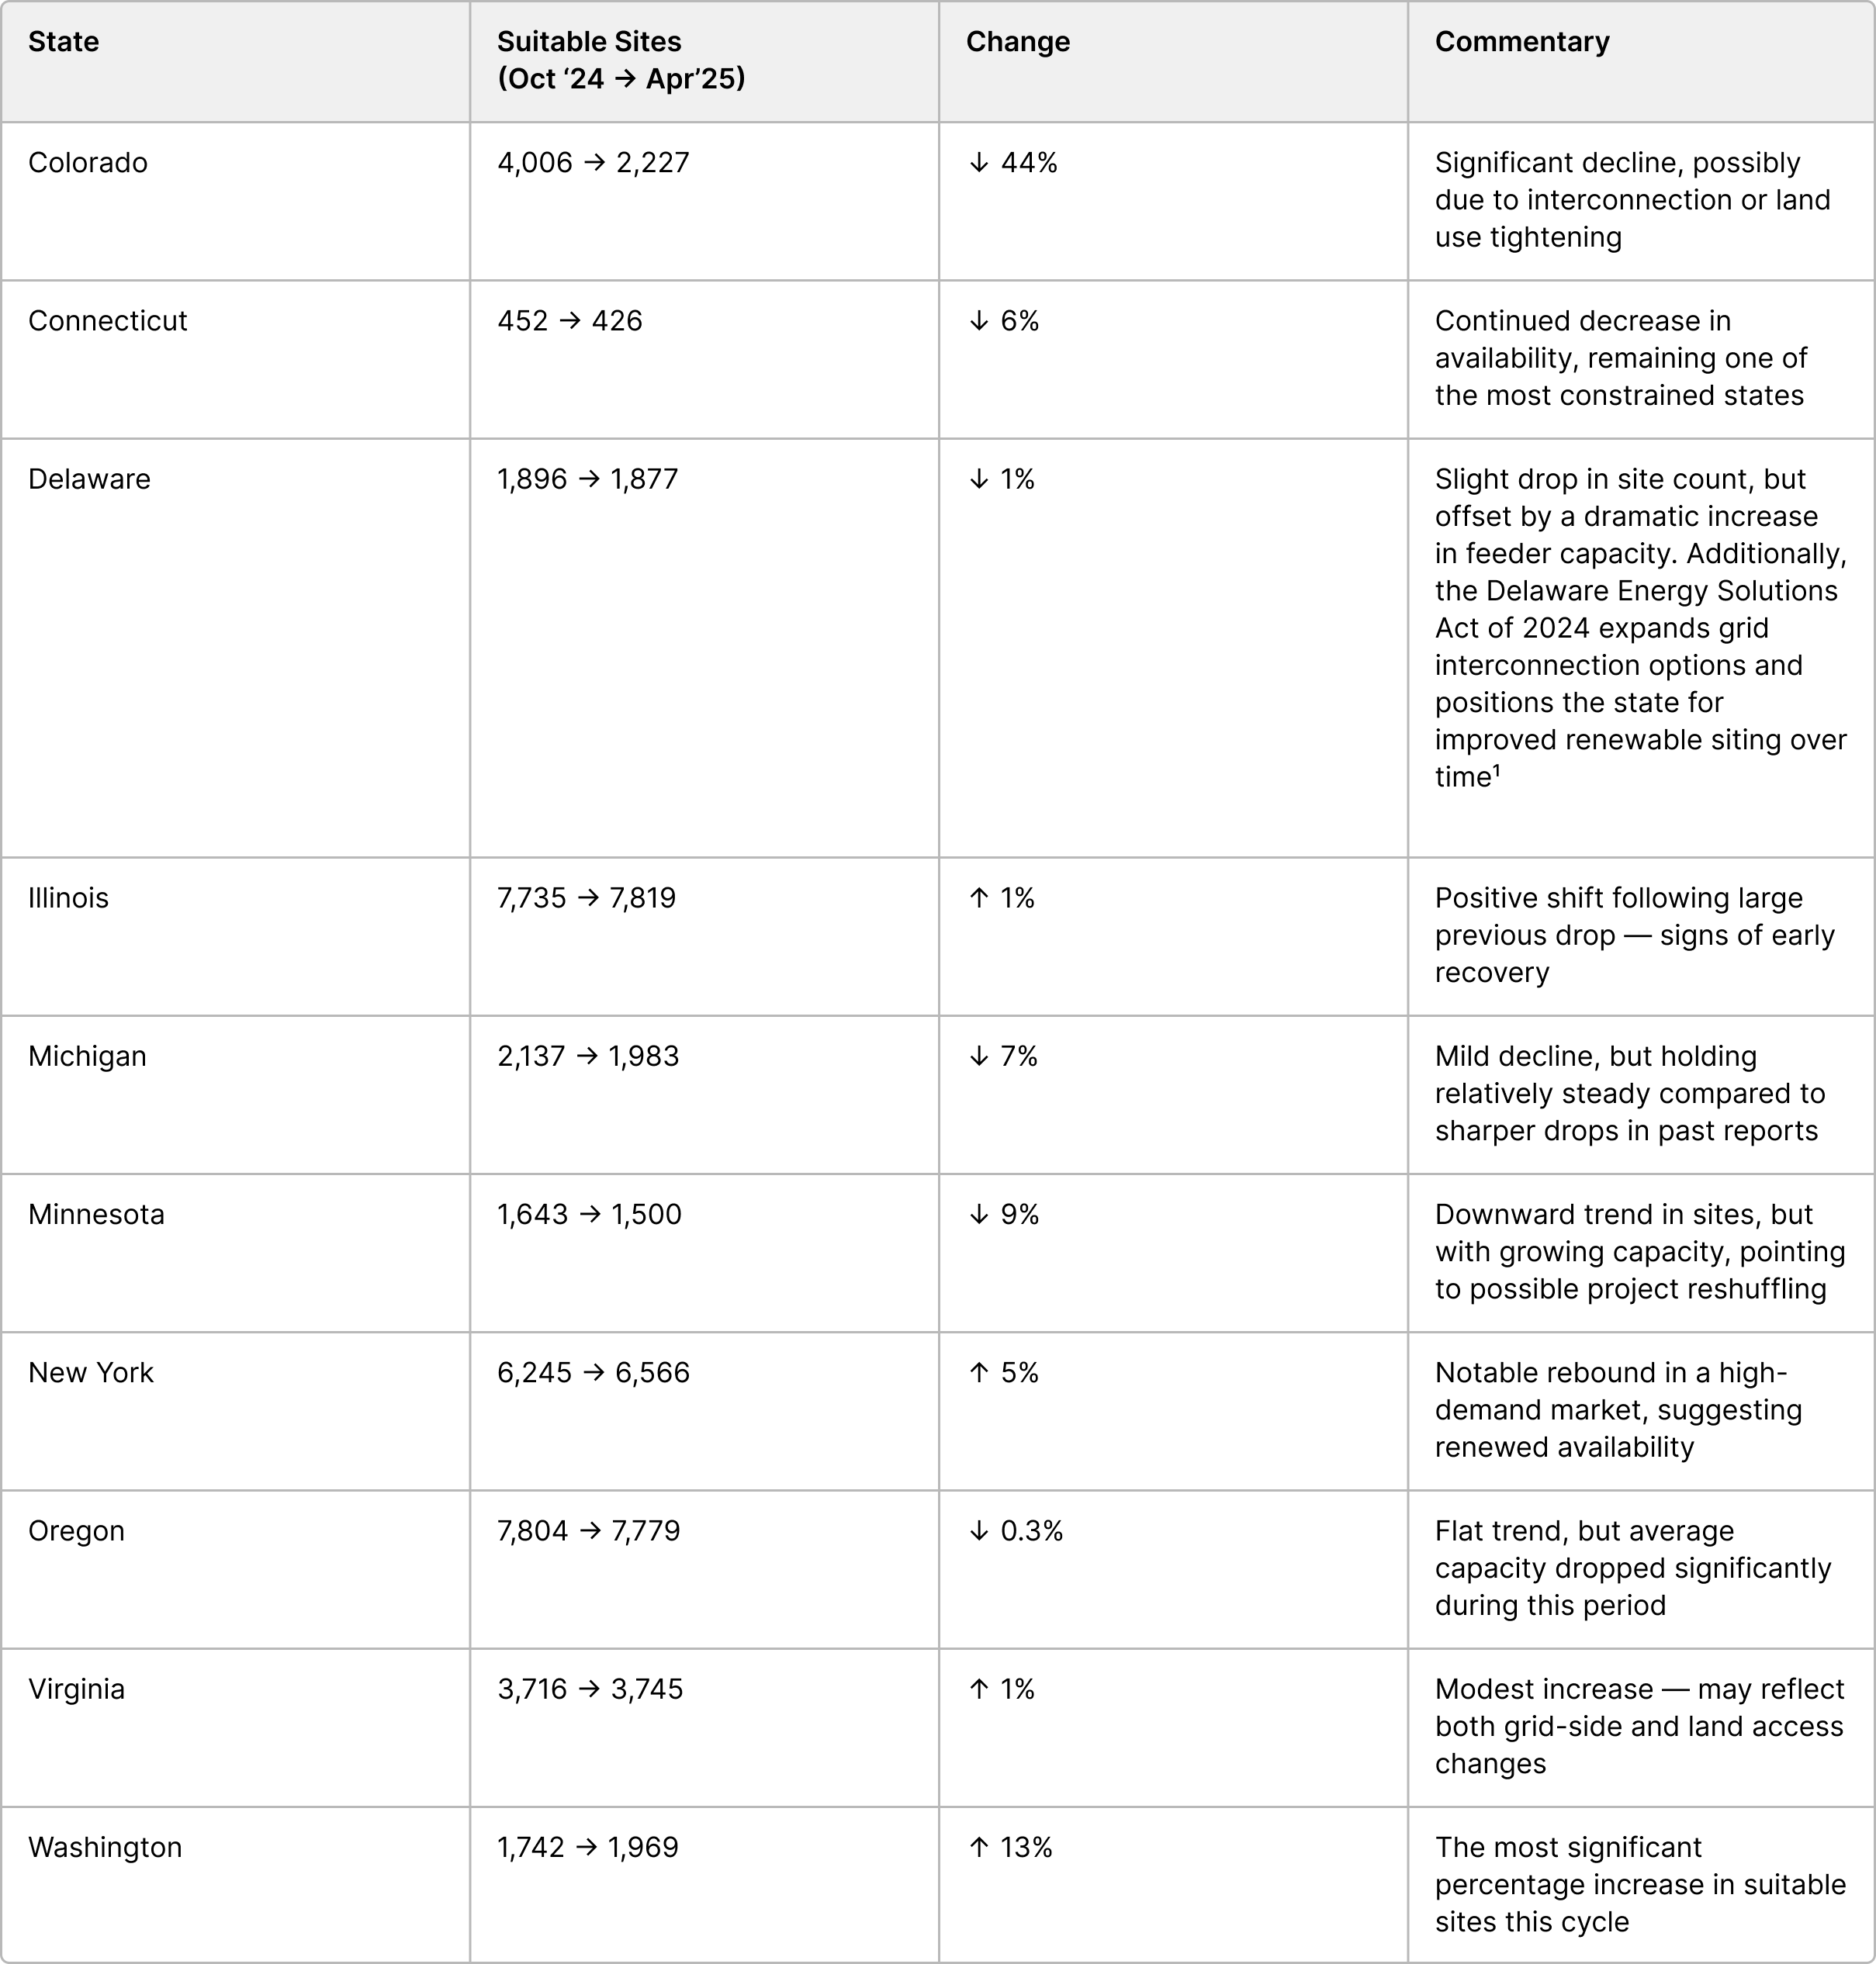
While acreage per site is trending smaller in many cases, increases in average hosting capacity, suggest new potential for smaller-scale or more distributed development strategies. The key for developers will be to track where these changes are happening and act quickly when local conditions shift.
Average Site Size is Still Declining — But Not Evenly
As developers evaluate suitable sites, average acreage per parcel continues to decline, a trend that may signal rising competition for larger parcels, shifts in zoning or permitting restrictions, or a growing focus on distributed or smaller-scale project footprints.
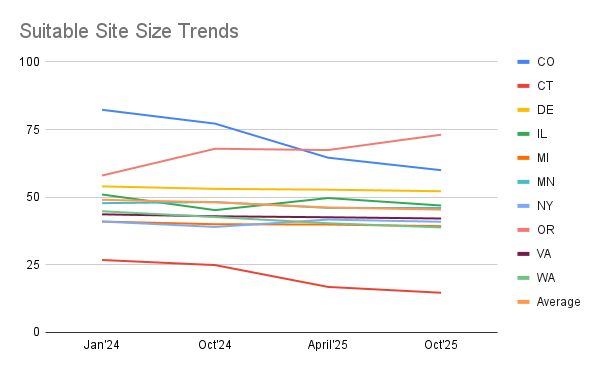
Across all states analyzed, the average site size decreased from 49.0 acres in January 2024 to 46 acres in April 2025. This decline suggests that hosting capacity is decreasing near the sites with the most buildable acreage, but the change is not uniform across states.
Notable highlights:
- Colorado and Connecticut saw some of the most significant decreases in average site size, with Colorado decreasing from 82.3 to 60 acres and Connecticut from 26.8 to 14.7 acres — potentially narrowing options for distributed generation sites in those states.
- Oregon, in contrast, was one of the few states to see an increase in average site size, rising from 58.0 acres in January 2024 to 67.4 acres in April 2025. This trend may be driven by a narrowing of available parcels to only the largest, most viable ones.
- Minnesota and New York maintained relatively stable site sizes, suggesting more consistent parcel availability or zoning flexibility.
While smaller sites may raise development complexity, they can also reflect a growing opportunity in distributed solar, especially with rising hosting capacity in some states.
Hosting Capacity is Flat or Trending Up in Key States
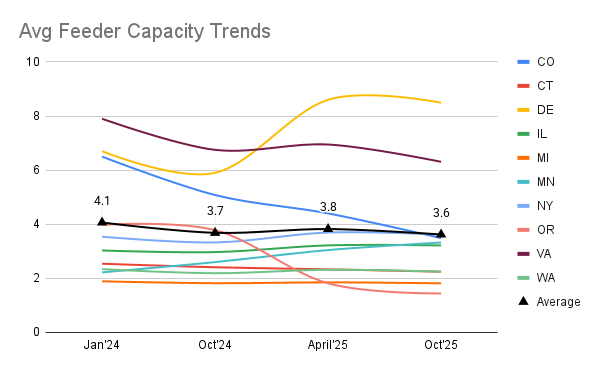
After a year of steady declines, April 2025 marks a notable shift in hosting capacity. Average feeder capacity increased from 3.7 MW in October 2024 to 4.0 MW in April 2025, marking a significant reversal from the downward trend observed over the previous 18 months.
While some states remain flat or show continued decreases, others, including Delaware, Minnesota, New York, and Virginia, see measurable increases in available feeder capacity.
These increases signal utility-side upgrades, projects falling out of queue, and better utility data.
Here’s how each state compares:
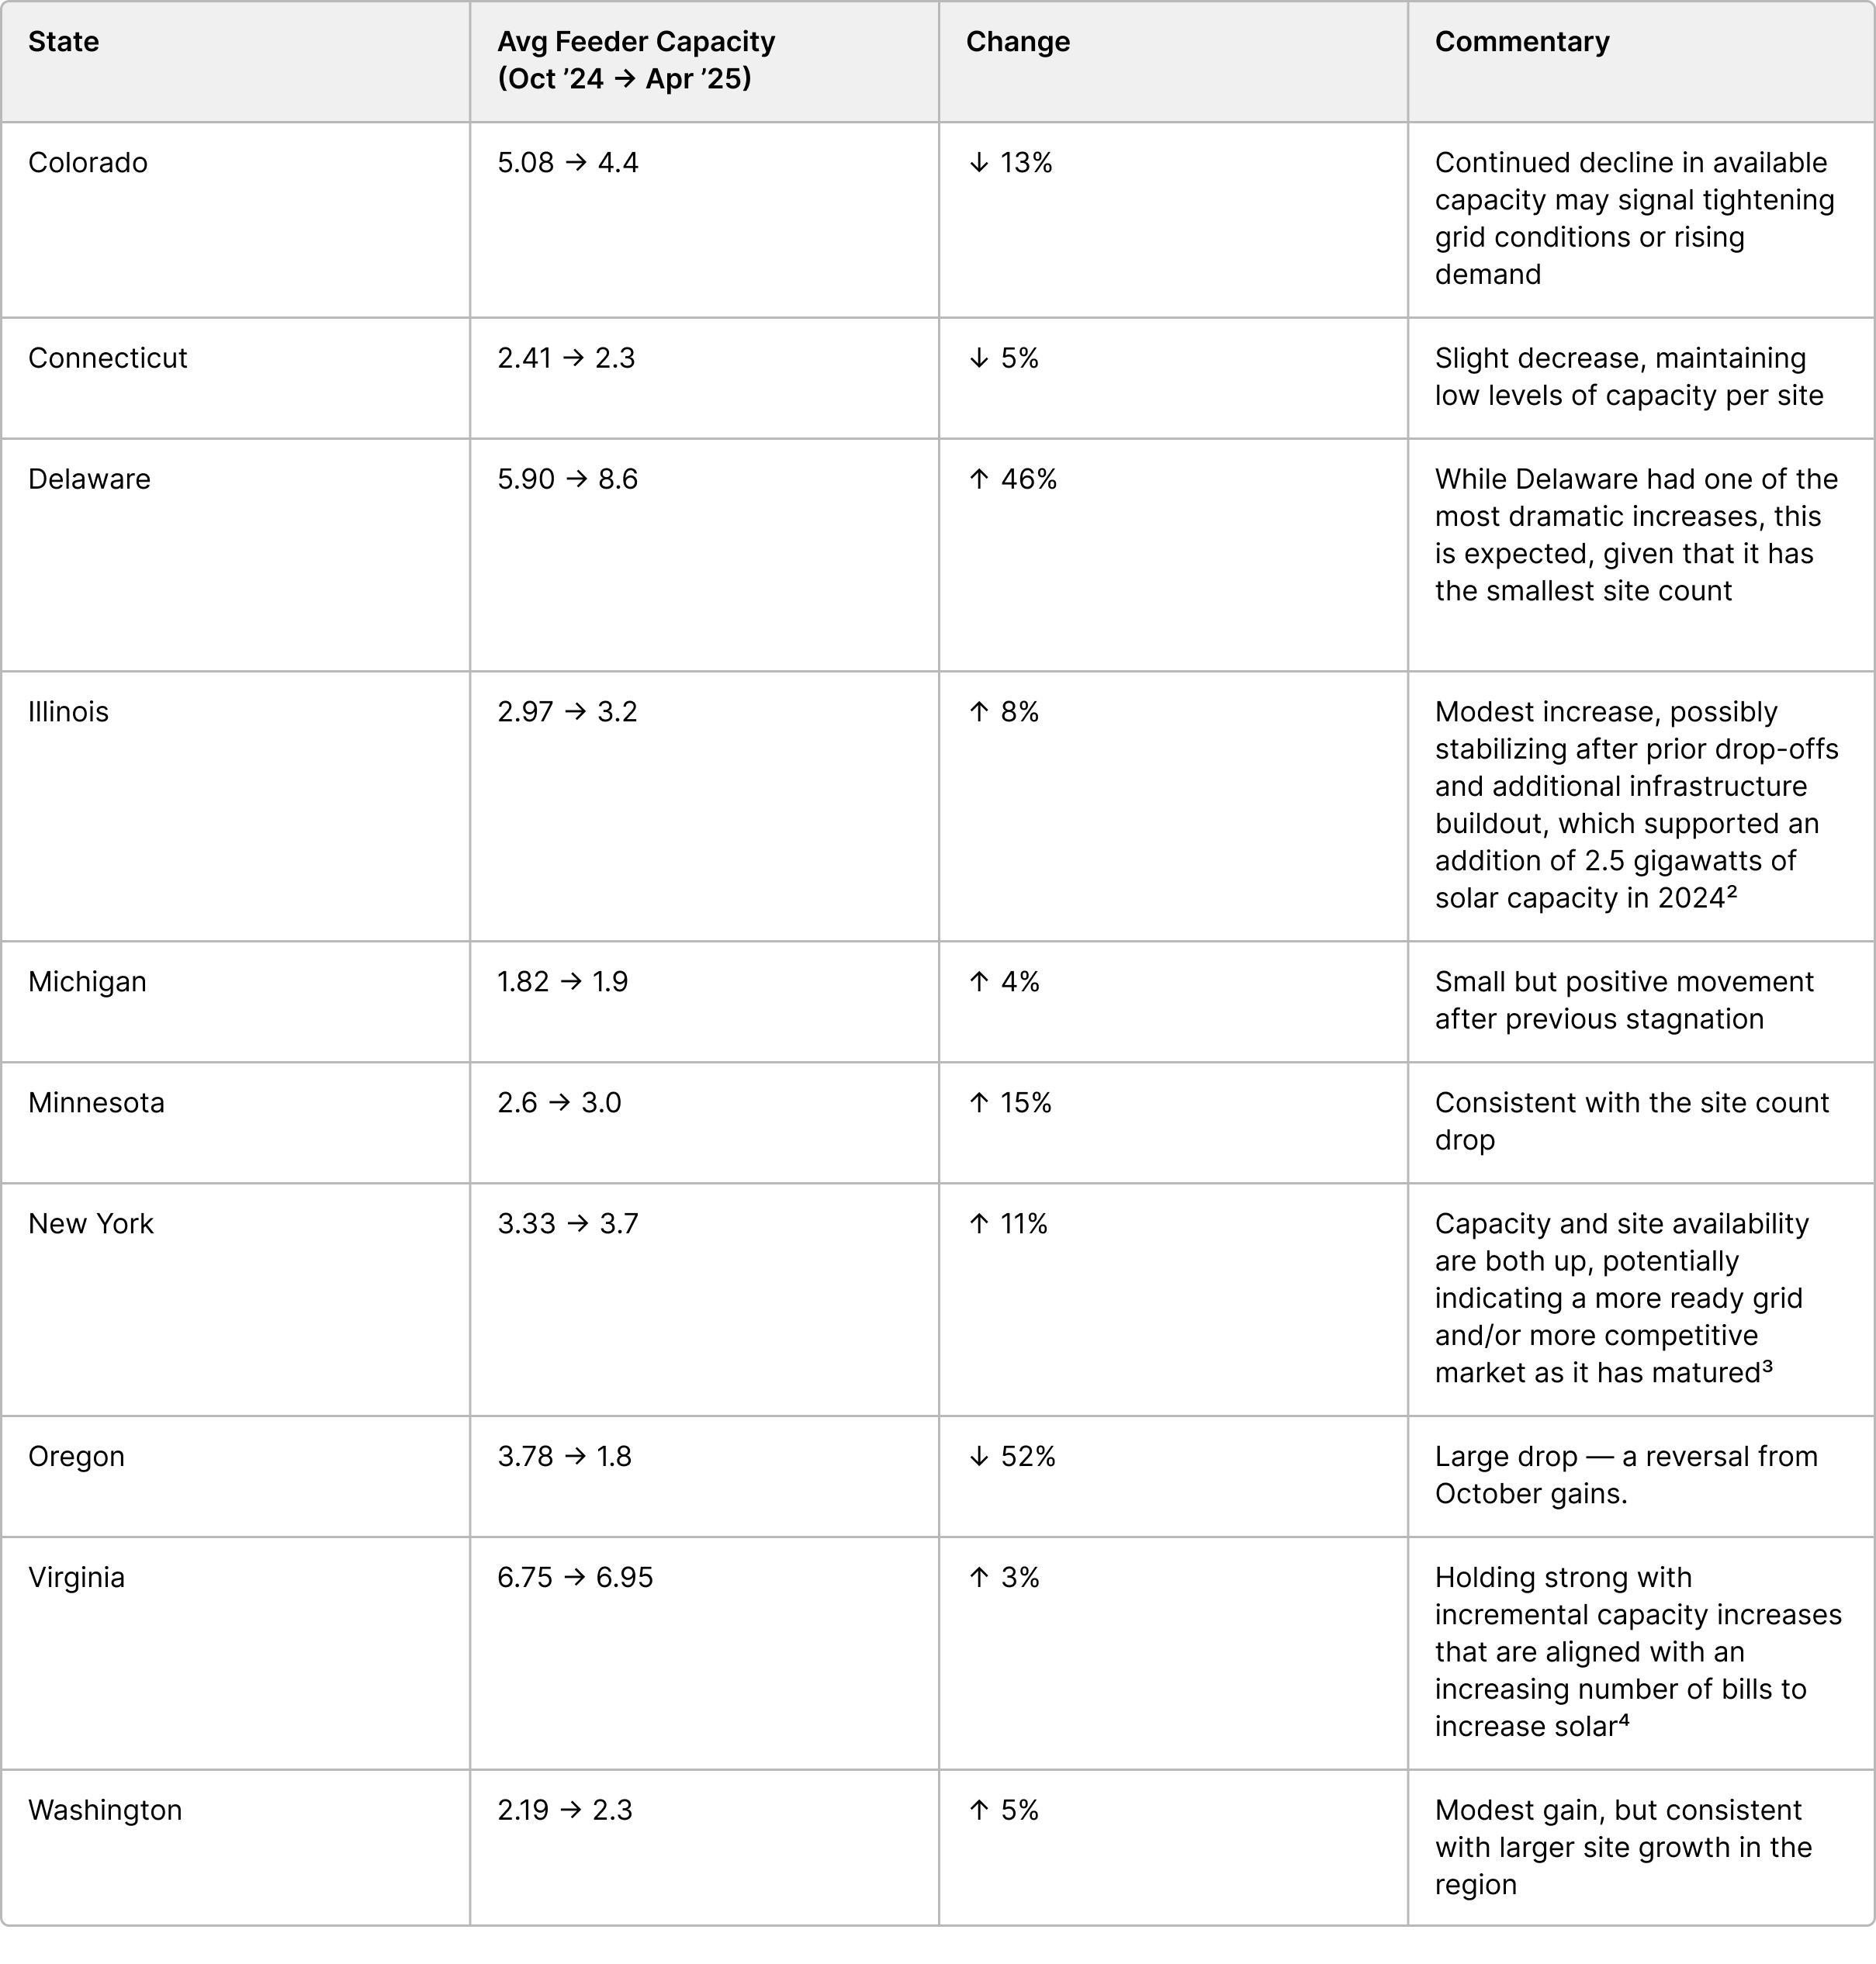
Even small changes in hosting capacity can significantly impact project viability, especially in markets where interconnection queue dynamics are rapidly changing. While state-level trends provide a top-line view, developers should continue to assess hosting capacity at the feeder and county levels to uncover opportunities others may miss.
AHJs with the Most Available Suitable Sites
While average site size continues to trend downward and suitable site availability remains limited in many areas, local clusters of opportunity persist, especially when analyzed at the Authority Having Jurisdiction (AHJ) level.
.png)
The chart below highlights the number of AHJs with 10 or more suitable sites as of April 2025. These jurisdictions represent high-concentration zones where developers may be able to identify viable projects with sufficient acreage and feeder capacity
This view shows how local zoning and interconnection dynamics create dense pockets of opportunity, even in states experiencing broader siting constraints. Developers looking to maximize efficiency — or build regional portfolios — should use AHJ-level targeting to guide their next moves.
How Developers Can Respond
1. Monitor Interconnection Movement, Not Just Permitting Signals
While permitting reform and policy incentives remain key drivers of market activity, developers should also closely monitor shifts in the interconnection queue and updates to feeder capacity. A project dropping out of the queue or a feeder upgrade could suddenly make a previously unviable area attractive.
2. Revisit Markets That Were Previously Written Off
States like New York and Illinois saw significant declines in 2023, but the April 2025 data shows clear signs of a rebound. Developers who paused activity in these regions may want to re-run their site analysis.
3. Get Granular — Not All Counties or Feeders Move the Same Way
While statewide trends are informative, real opportunity lies in sub-AHJ variation. Some counties or feeders show drastic improvements, even when state-level metrics look flat. Paces allows you to zero in on these changes in real time.
In today’s fast-changing siting landscape, developers need more than static map layers or spreadsheets — they need real-time intelligence and the tools to act on it.
_____________________________________________________________
Paces is purpose-built to help developers get to the right sites faster and more confidently.
- Dynamic site filtering across land, power, zoning, and permitting constraints.
- Detailed zoning, AHJ maps, and permitting layers to screen high-risk sites upfront
- Collaboration tools to centralize site evaluations and move faster as a team
However, as the list of viable sites continues to shrink, finding the right location before competitors do is more critical than ever. That’s where Paces Managed comes in. With Paces Managed, we don’t just help you search — we help you win. Our team delivers high-confidence, pre-vetted sites tailored to your criteria.
This combination of software and service ensures that you'll stay ahead of the curve, whether you're scaling a team or navigating tight development timelines.
For a deeper look at the data-driven approach to accelerating clean energy development — and how early-stage risk modeling can dramatically improve project outcomes — read our white paper, Pre-Development at Scale: Modeling Risk in Early-Stage Solar Development.
Conclusion
Solar siting in 2025 is becoming more dynamic, and the pace of change is reshaping where and how projects move forward.. While land constraints and permitting remain challenges, the emergence of feeder capacity in several states signals the potential for new waves of development. The opportunity extends beyond finding new markets — it also depends on knowing when existing markets are ready again.Already a Paces customer? Talk to your CSM to learn how to leverage Paces for DG in your states. Not yet a customer? Book a call to talk about the best way to infiltrate new markets.
Appendix
- https://legis.delaware.gov/BillDetail/141232
- https://techxplore.com/news/2025-03-year-solar-illinois-nationwide-customers.html
- https://www.cenhud.com/globalassets/pdf/my-energy/solar-summit/2025/ny-solar-industry-briefing-nyseia.pdf
- https://virginiamercury.com/2025/02/03/bills-to-bring-more-solar-to-virginia-are-moving-this-year/
Sign up for emails
Find the right sites faster, assess feasibility with world class data, and track progress across your entire project pipeline with software built to compress your workflow.