Data Center Site Analysis: Indiana & Texas - January 2026
Executive Summary
The race for power-ready data center sites is intensifying. As AI workloads drive unprecedented demand for grid capacity, developers face a critical question: where can you actually access the power you need, and how long will those opportunities last?
This report marks the first in our new monthly Data Center Site Analysis series, providing a county-level view of site availability and quality across two critical markets: Indiana and Texas. By tracking how withdrawal capacity and site scores evolve month-over-month, developers can identify opportunities before they disappear and understand which markets are gaining or losing viable inventory before going deeper in a site search. Sign up for our email, so you can be the first to know about new market assessments every month.
For Texas, we also analyzed historical data from July 2025, revealing a steady decline in available sites over the past six months.
Methodology
This report analyzes data center siting opportunities across Indiana and Texas as of January 2026, focusing on sites with viable path to power. We perform a bottom-up analysis of on- and off-market sites, evaluating comprehensive infrastructure and location factors that directly impact development feasibility.
Data Center Score Components:
Our Data Center Score evaluates each site on eight critical factors, with scores ranging from 1-5 (5 being optimal):
- Total buildable acreage
- Maximum continuous buildable acreage
- Distance to transmission lines
- Voltage of transmission lines (kV)
- Distance to fiber infrastructure
- Distance to population centers (200K+)
- Distance to gas pipelines (10"+ diameter, Texas only)
- Maximum withdrawal capacity (MW) from nearby substations, based on:
- Indiana: MISO Withdrawal Capacity (MTEP25AA Summer Peak 2027)
- Texas: ERCOT Withdrawal Capacity (SSWG25 Summer Peak 2028)
How we weight the variables:
Our scoring methodology prioritizes the factors that most directly impact development feasibility:
- 50% weight: Grid capacity
- 20% weight: Grid infrastructure
- 15% weight: Site size & buildability
- 15% weight: Other infrastructure and workforce
Sites with insufficient interconnection capacity, regardless of how well they score on other metrics, face extended timelines and significant costs for grid upgrades, which is why it carries the heaviest weight in our analysis.
Each site then receives an independent score from 1-5, allowing developers to identify absolute quality rather than relative rankings. Sites are not scored against each other: a score of 4.5 represents the same level of readiness regardless of which state or county it's in.
Score ranges:
To simplify market analysis, we group sites into ranges based on their final scores:
- 4-5: Premium sites with optimal infrastructure and power capacity
- 3-3.9: Acceptable development opportunities with good fundamentals
- 2-2.9: Marginal sites requiring additional infrastructure investment
- <2: Below development threshold for most projects
Key findings
The big picture: two very different markets
Indiana presents a smaller, tighter market with 898 sites across 45 counties, while Texas offers a significantly larger landscape with 3,297 sites across 89 counties. However, size isn't the only differentiator. The two states show distinct patterns in site quality distribution.
Site Quality Distribution:
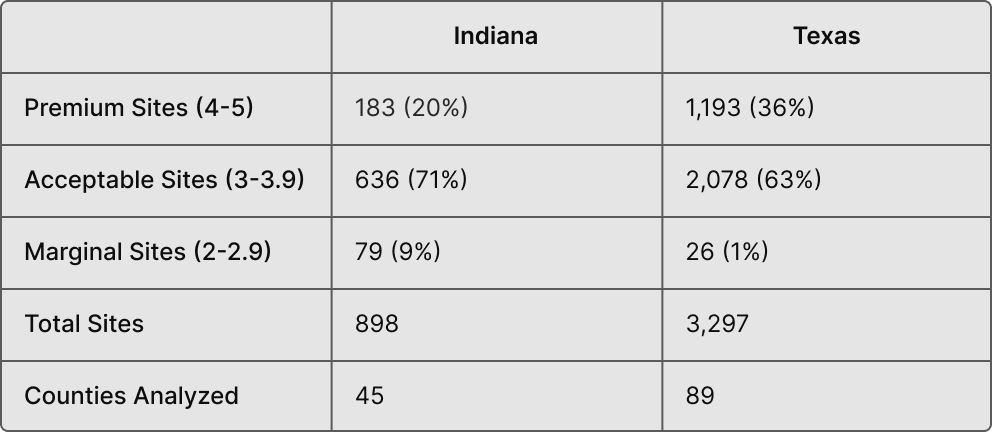
Texas has nearly 3.7x more sites than Indiana, with a significantly higher proportion of premium-quality opportunities. More than one-third of Texas sites score in the 4-5 range, compared to one-fifth in Indiana. This disparity reflects Texas's larger geographic footprint, larger plots, and more robust transmission infrastructure supporting ERCOT's grid.
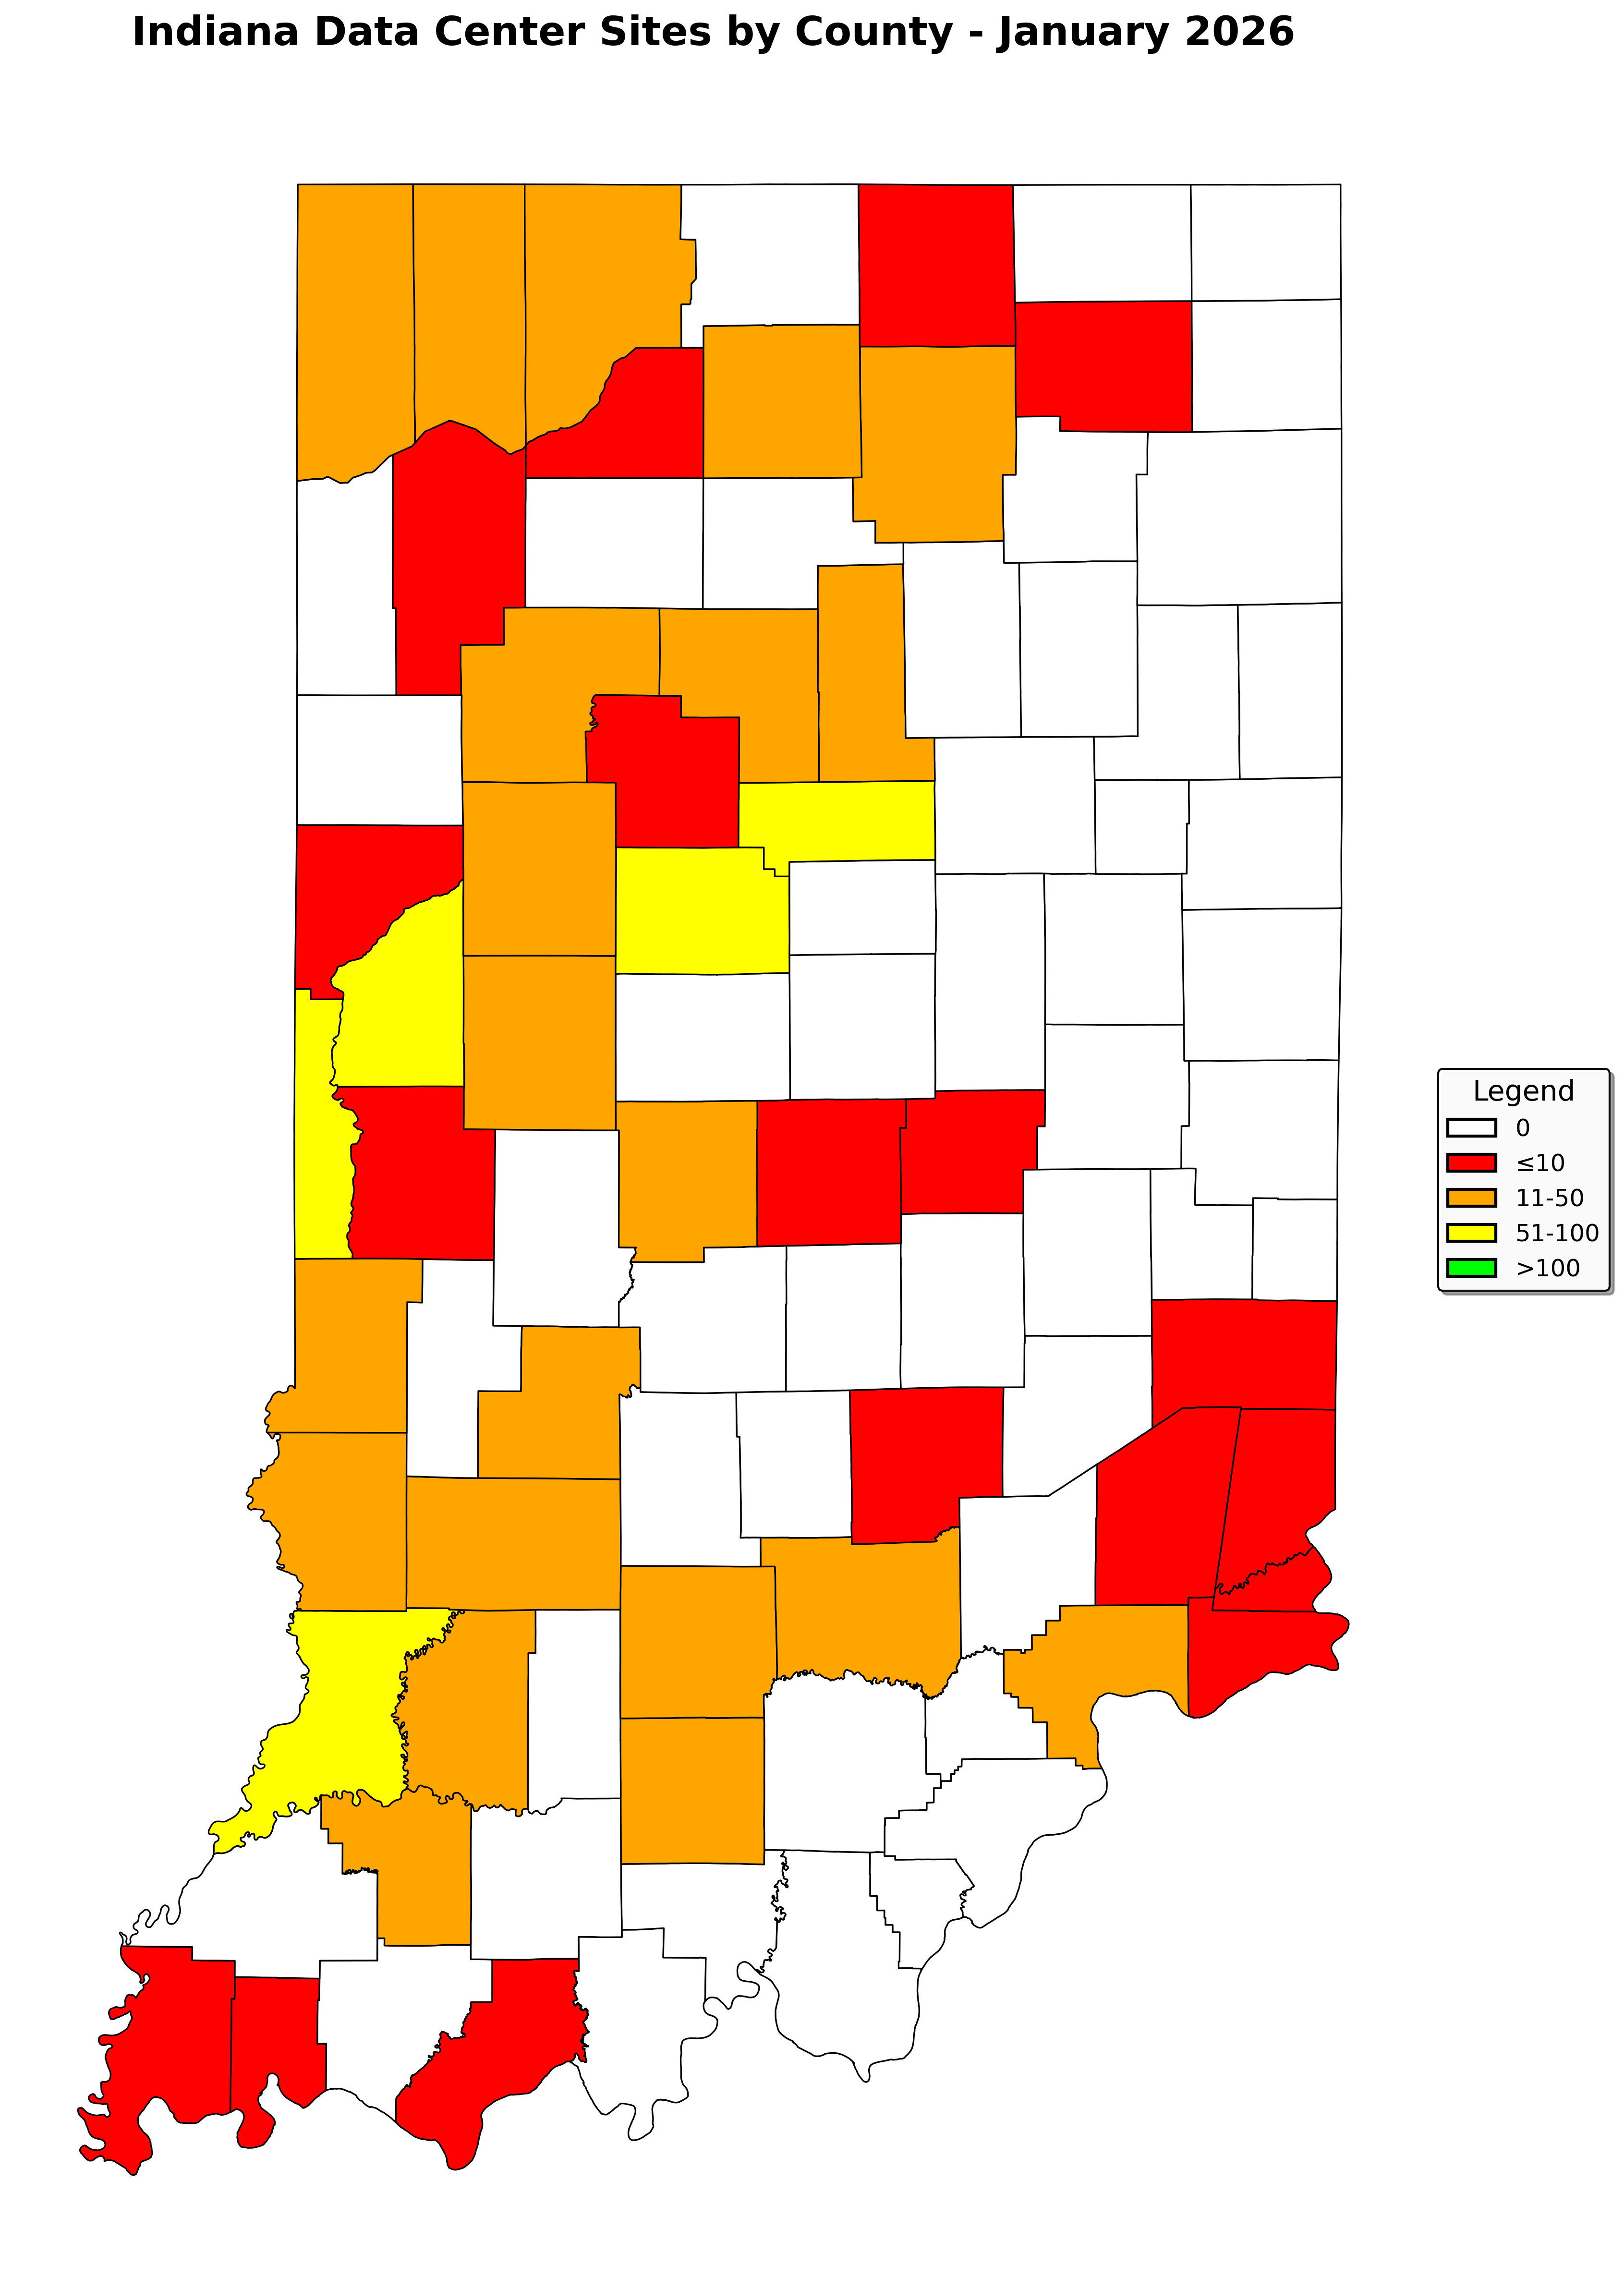
Indiana: concentrated excellence in select markets
Indiana's data center landscape clusters around a handful of high-performing counties, with limited geographic diversity in premium sites.
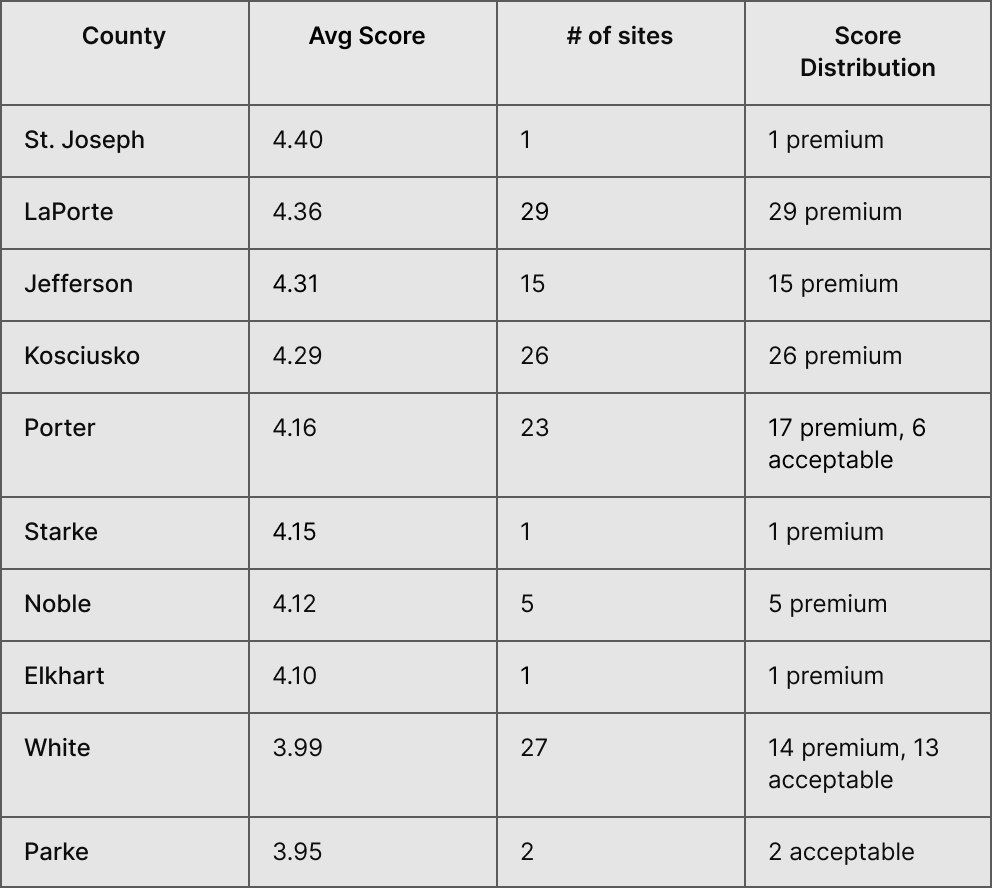
Top counties by average data center score:
Counties with highest site volume :

Key takeaways for Indiana:
- Northern Indiana dominates: LaPorte, Kosciusko, and Porter counties represent the state's deepest premium inventory
- Limited premium depth: Only 183 premium sites statewide means competition will intensify quickly
- High-volume alternatives: Knox (80 sites), Fountain (77 sites), and Howard (69 sites) offer quantity over top-tier quality
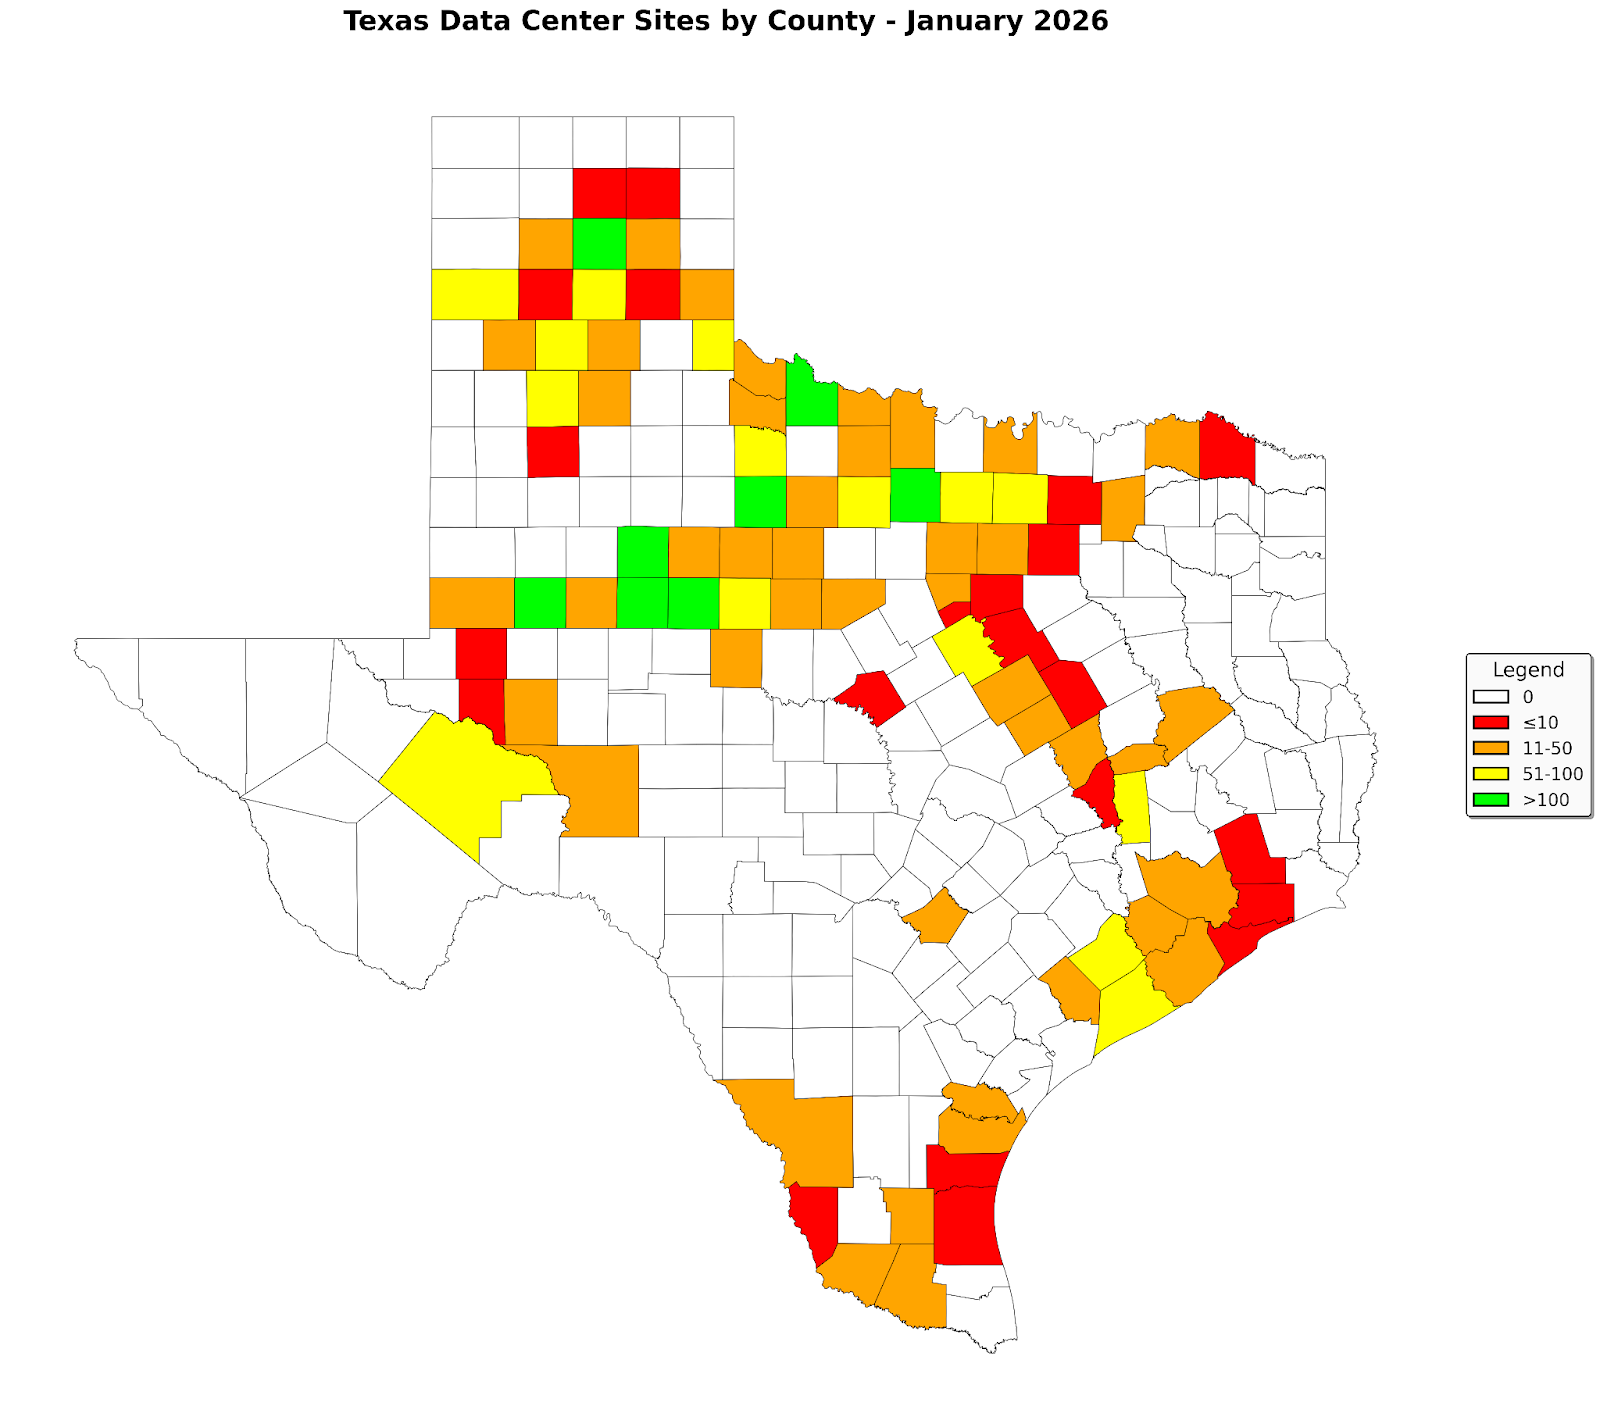
Texas: scale, diversity, and panhandle strength
Texas presents a fundamentally different opportunity set with more sites, higher average scores, and greater geographic distribution.
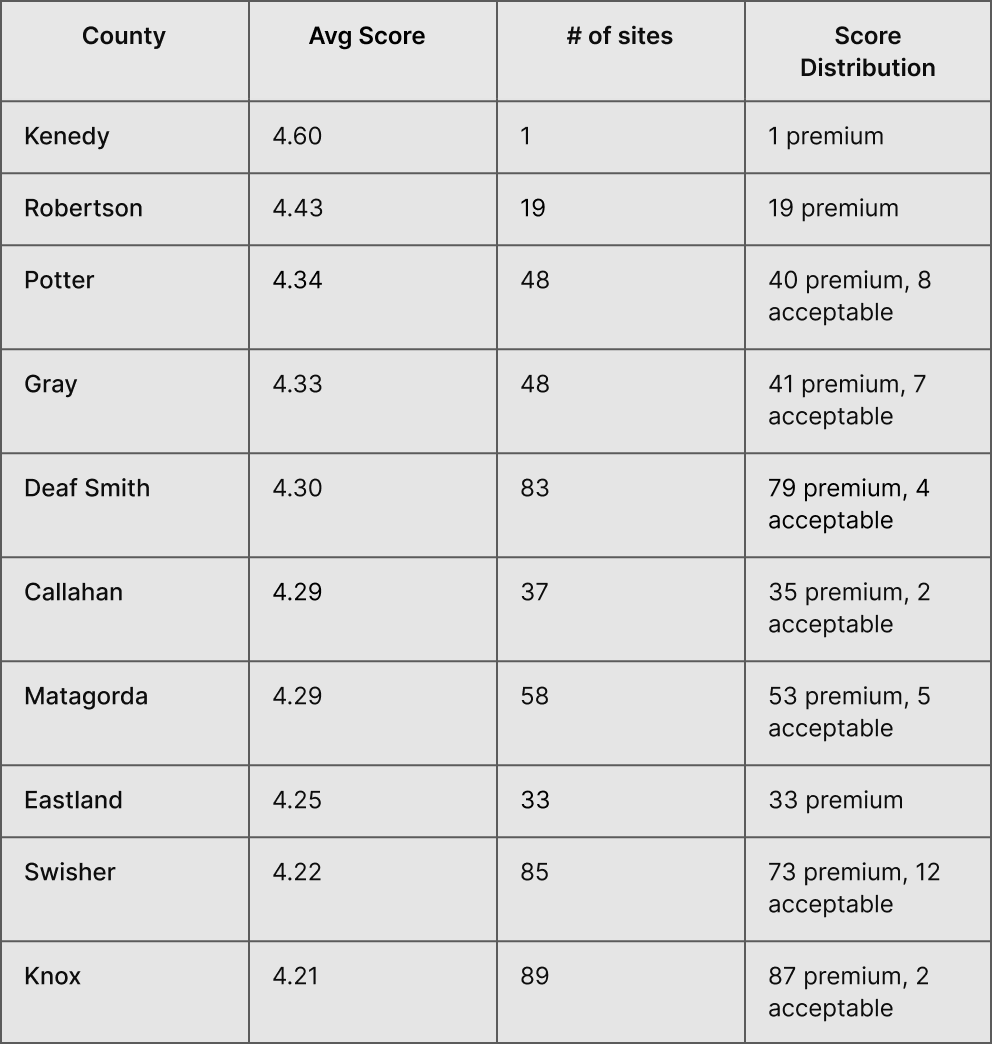
Top counties by average data center score:
Counties with highest site volume:
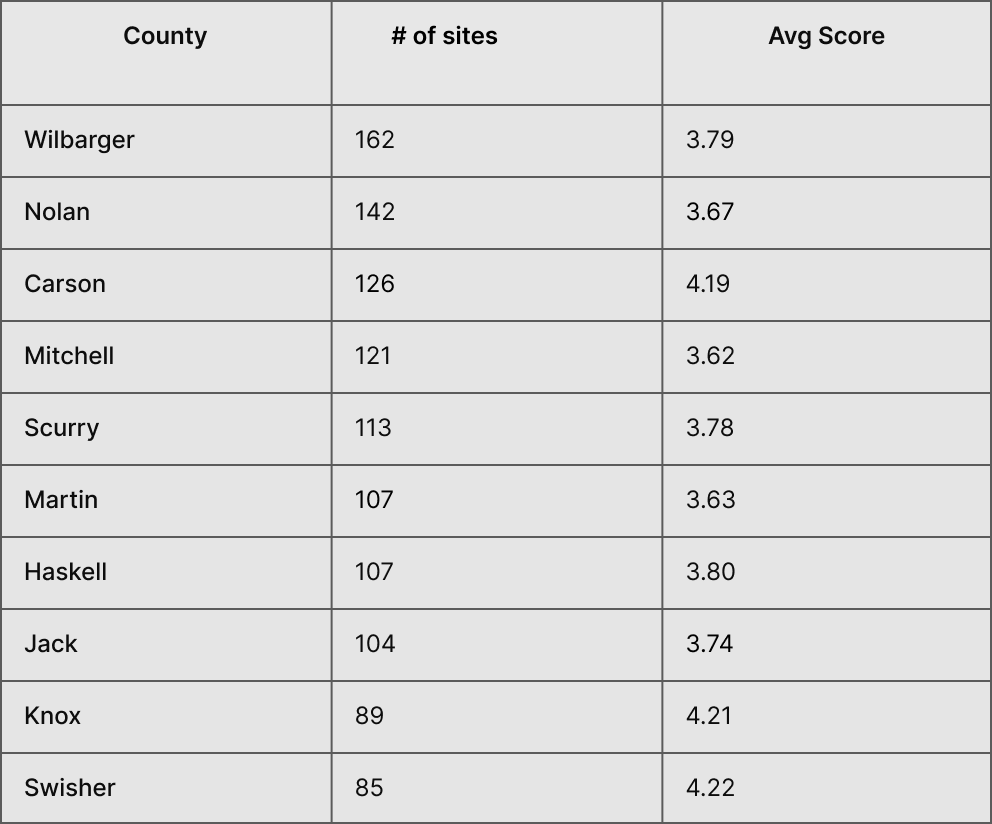
Key takeaways for Texas:
- Powerhouse of the Panhandle and surrounding areas: Counties like Deaf Smith, Swisher, Knox, Potter, and Gray combine high scores with deep inventory
- Geographic diversity: Premium sites exist across multiple regions—Panhandle, West Texas, Gulf Coast, Central Texas
- Volume + quality paradox: Some high-volume counties (Carson, Knox, Swisher) maintain premium average scores, while others (Wilbarger, Nolan, Mitchell) trade volume for moderate quality
The Texas trajectory: six months of decline, six months ahead
While the January 2026 snapshot shows where Texas stands today, historical data reveals a critical trend: available sites are disappearing faster than many developers realize.
Using historical data from July 2025, we tracked the change in available sites across Texas counties over the past six months and projected the trend forward to July 2026. The statewide trend shows a steady decline in available sites, with linear projections suggesting this will continue through mid-2026 as developers claim capacity and projects move forward.
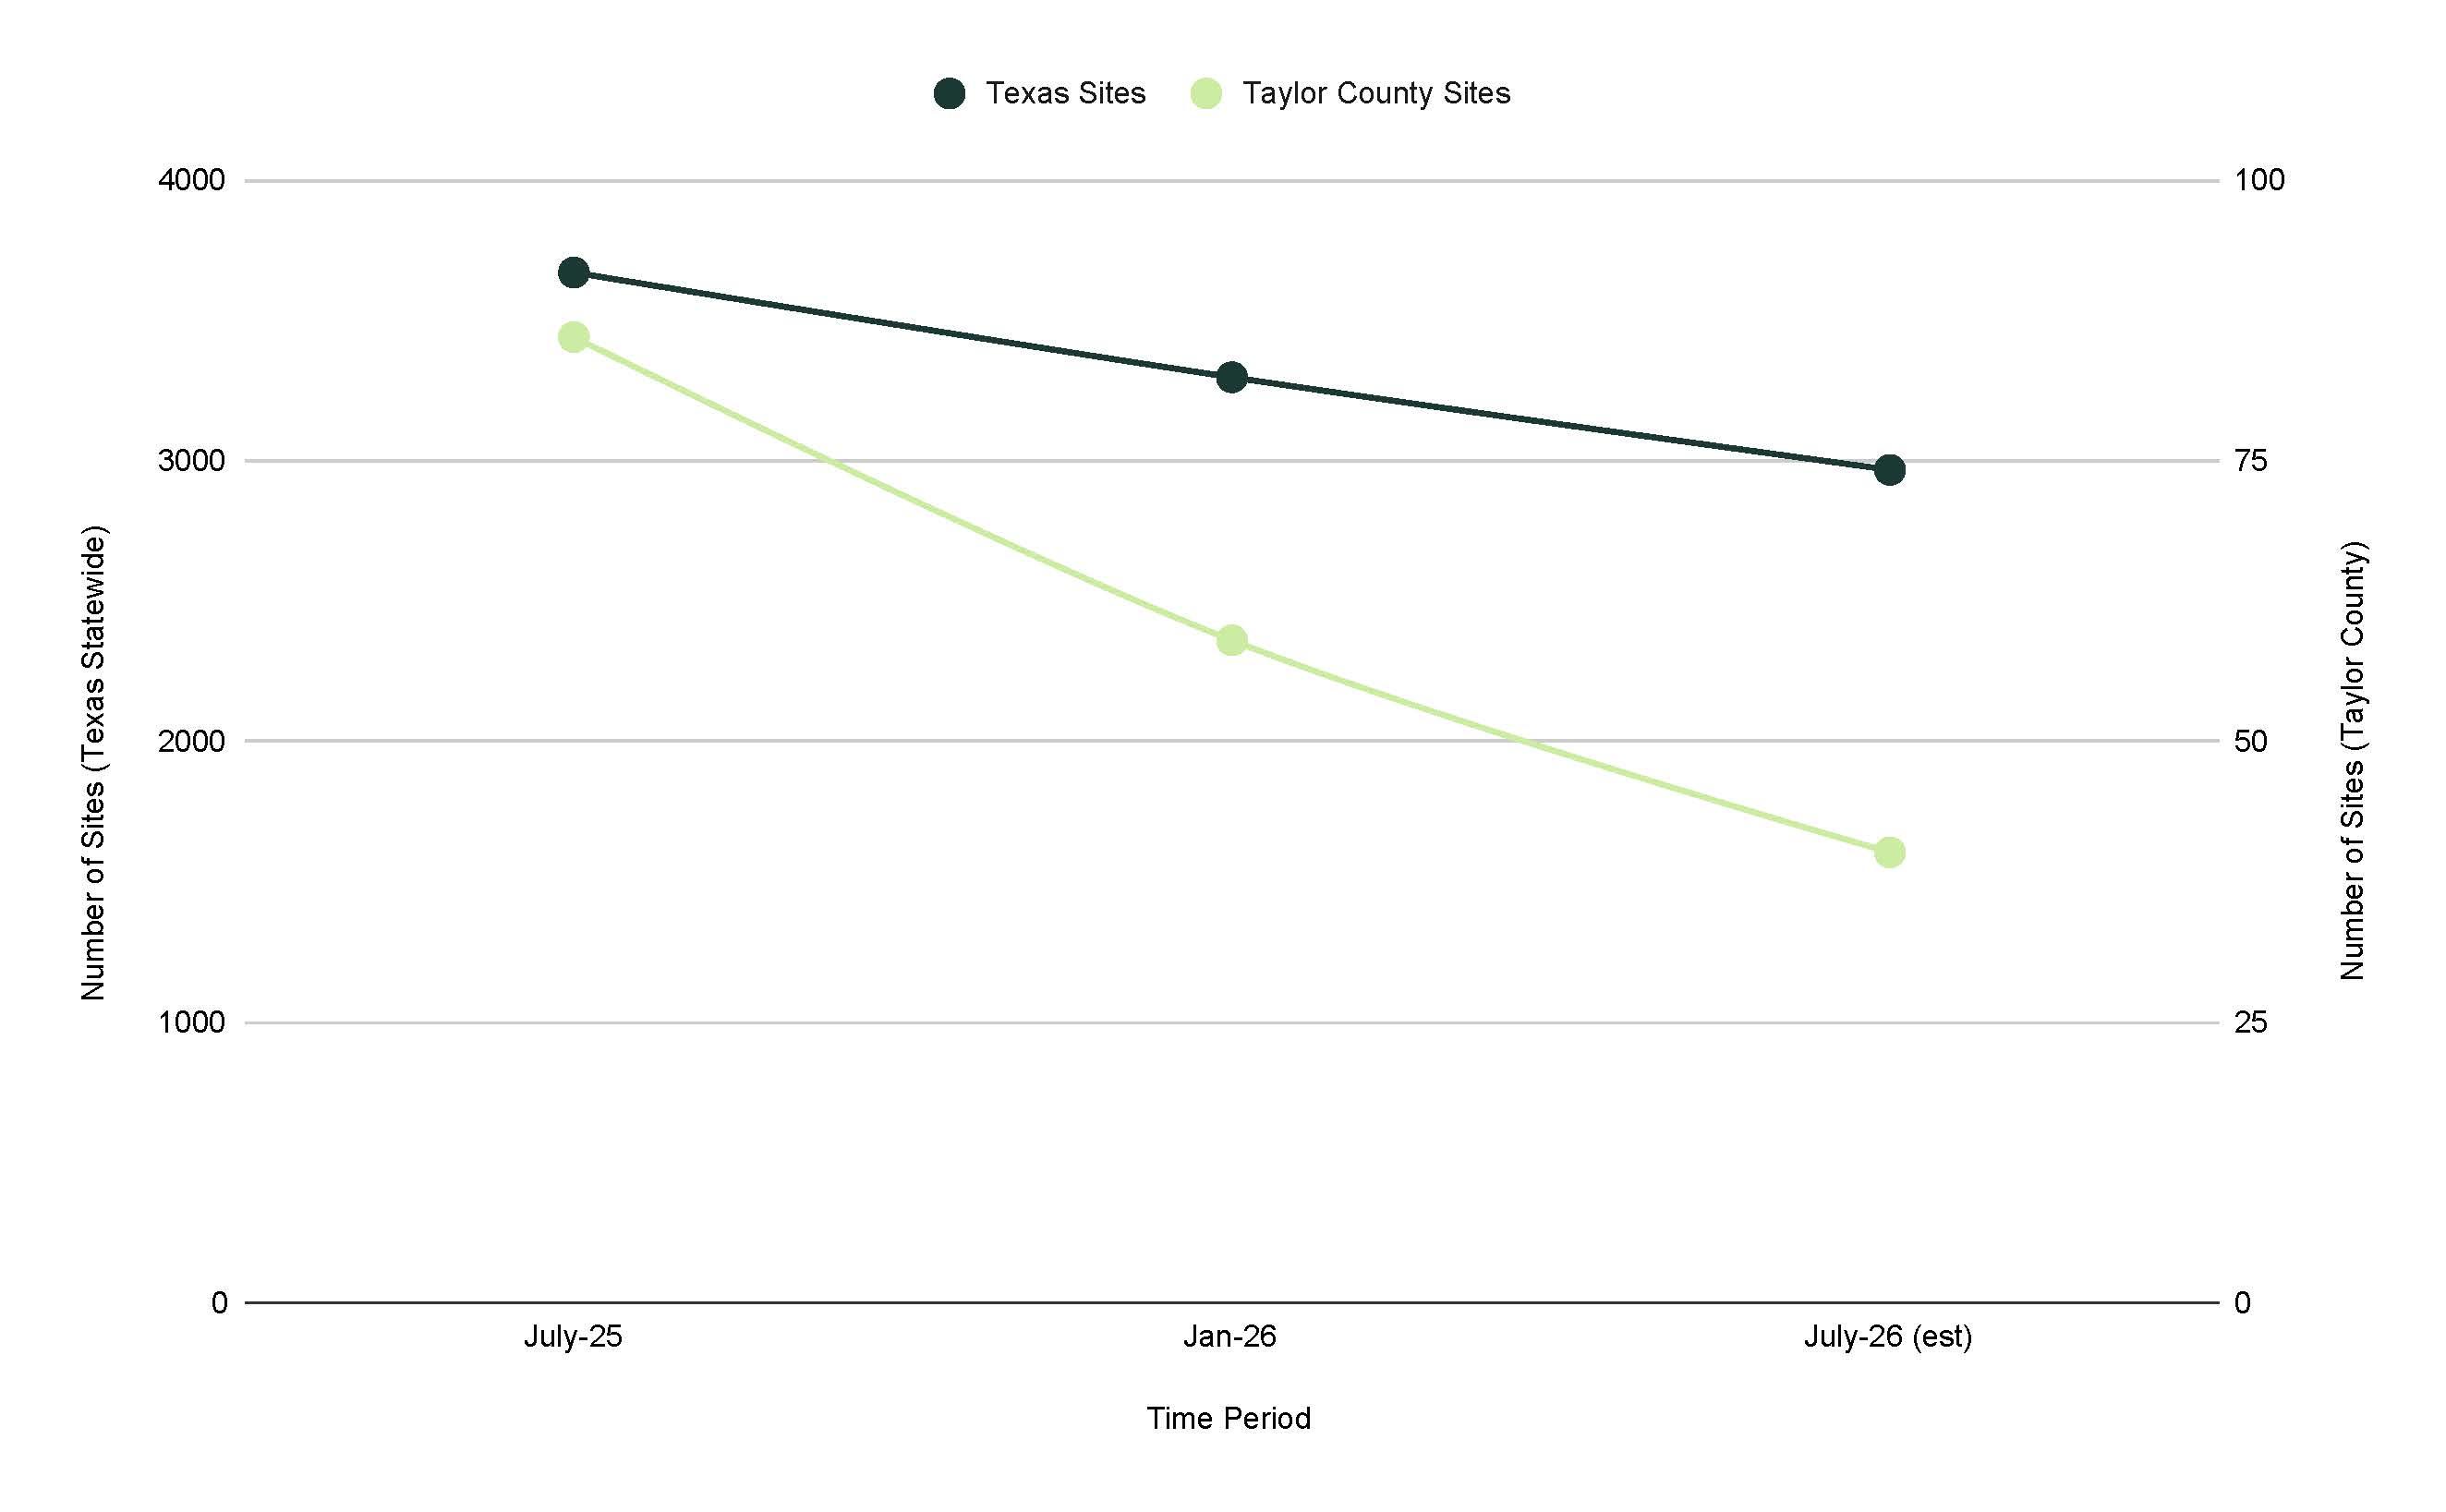
Taylor County: A Case Study in Rapid Contraction
While the statewide trend is gradual, individual counties tell more dramatic stories. Taylor County—home to significant data center development activity—exemplifies how quickly a hot market can shift. The county experienced a significantly steeper decline in available sites compared to the statewide average. This demonstrates that:
- High-quality sites in emerging markets can be claimed rapidly once developers identify them
- County-level tracking is essential; statewide averages mask dramatic local changes
- Six months can fundamentally reshape a county's development landscape as projects enter the interconnection queue
This historical view reinforces a critical reality: the sites available today will not be available next month. Developers who wait for "perfect" data or delay site selection while conducting broader market analysis risk losing access to the best opportunities entirely.
How to stay ahead
This January 2026 snapshot captures the market as it stands today. But as projects move forward, interconnection queues shift, and utilities update capacity projections, these numbers will change. Counties with 50 sites today might have 35 next month. Average scores in a region could jump—or drop—as new data reflects grid upgrades or capacity commitments.
The sites available today may not be available next month.
Developers relying on static analysis will miss opportunities or pursue sites that are already spoken for. The advantage goes to those who track changes in real time.
This analysis of Indiana and Texas is just the beginning. Over the coming months, we'll be:
- Expanding to additional states with county-level site analysis
- Tracking month-over-month changes in site availability and withdrawal capacity
- Identifying emerging markets where grid upgrades create new opportunities
Want to be first to know when the next report covering more states comes out and when site landscapes shift? Sign up below for our email updates.
And when you're ready to go beyond county-level aggregates to identify specific sites with detailed parcel data, transmission specifications, and substation capacity analysis, that's where Paces comes in.
Sign up for emails
Find the right sites faster, assess feasibility with world class data, and track progress across your entire project pipeline with software built to compress your workflow.