Data Center Site Analysis: February 2026
*Our methodology is covered in full below, but it’s important to note that all scores focus on infrastructure and maximum withdrawal capacity and do not account for permitting, community sentiment, and other risks, which further impact the viability of sites. Additionally, each state’s withdrawal capacity is evaluated by the future ISO capacity projections. Ex. Virginia and Ohio scores specifically are based on PJM capacity projections for Summer Peak 2030, not the currently available capacity, and both states are heavily grid-constrained today. For a complete and deeper picture, contact Paces.
Methodology
How we score every site:
This report analyzes data center siting opportunities across the seven states as of February 2026, to determine where sites with a viable path to power sit. We perform a bottom-up analysis of on- and off-market sites, evaluating comprehensive infrastructure and location factors that directly impact development feasibility.
Data center score components:
Our Data Center Score evaluates each site on eight critical factors, with scores ranging from 1–5 (5 being optimal):
- Total buildable acreage
- Maximum continuous buildable acreage
- Distance to transmission lines
- Voltage of transmission lines (kV)
- Distance to fiber infrastructure
- Distance to population centers (200K+)
- Distance to gas pipelines (10"+ diameter, Texas only)
- Maximum withdrawal capacity (MW) from nearby substations, based on:
- Indiana: MISO Withdrawal Capacity (MTEP25AA Summer Peak 2027)
- Texas: ERCOT Withdrawal Capacity (SSWG25 Summer Peak 2028)
- Virginia, Ohio, Pennsylvania: PJM (RTEP25 Summer Peak 2030)
- Missouri, and Illinois: MISO (MTEP25AA Summer Peak 2030)
How we weight the variables:
Our scoring methodology prioritizes the factors that most directly impact development feasibility:
- 50% weight: Grid capacity
- 20% weight: Grid infrastructure
- 15% weight: Site size & buildability
- 15% weight: Other infrastructure and workforce
Sites with insufficient interconnection capacity face extended timelines and significant costs for grid upgrades regardless of how well they score on other metrics which is why it carries the heaviest weight in our analysis.
Each site then receives an independent score from 1-5, allowing developers to identify absolute quality rather than relative rankings. Sites are not scored against each other: a score of 4.5 represents the same level of readiness regardless of which state or county it's in.
Score ranges:
To simplify market analysis, we group sites into ranges based on their final scores:
- 4–5: Premium sites with optimal infrastructure and power capacity
- 3–3.9: Acceptable development opportunities with good fundamentals
- 2–2.9: Marginal sites requiring additional infrastructure investment
- Below 2: Below development threshold for most projects
Key findings: The seven-state landscape
Across seven states with complete February data, Paces tracks 23,792 total sites. Texas leads in premium concentration (33.8%), Ohio delivers unmatched raw volume (6,886 sites), and Missouri is most constrained (48 premium parcels, 5.3%). Indiana’s meaningful inventory contraction signals how quickly MISO-belt site availability can shift in a single cycle.
Seven-state summary: February 2026

Illinois
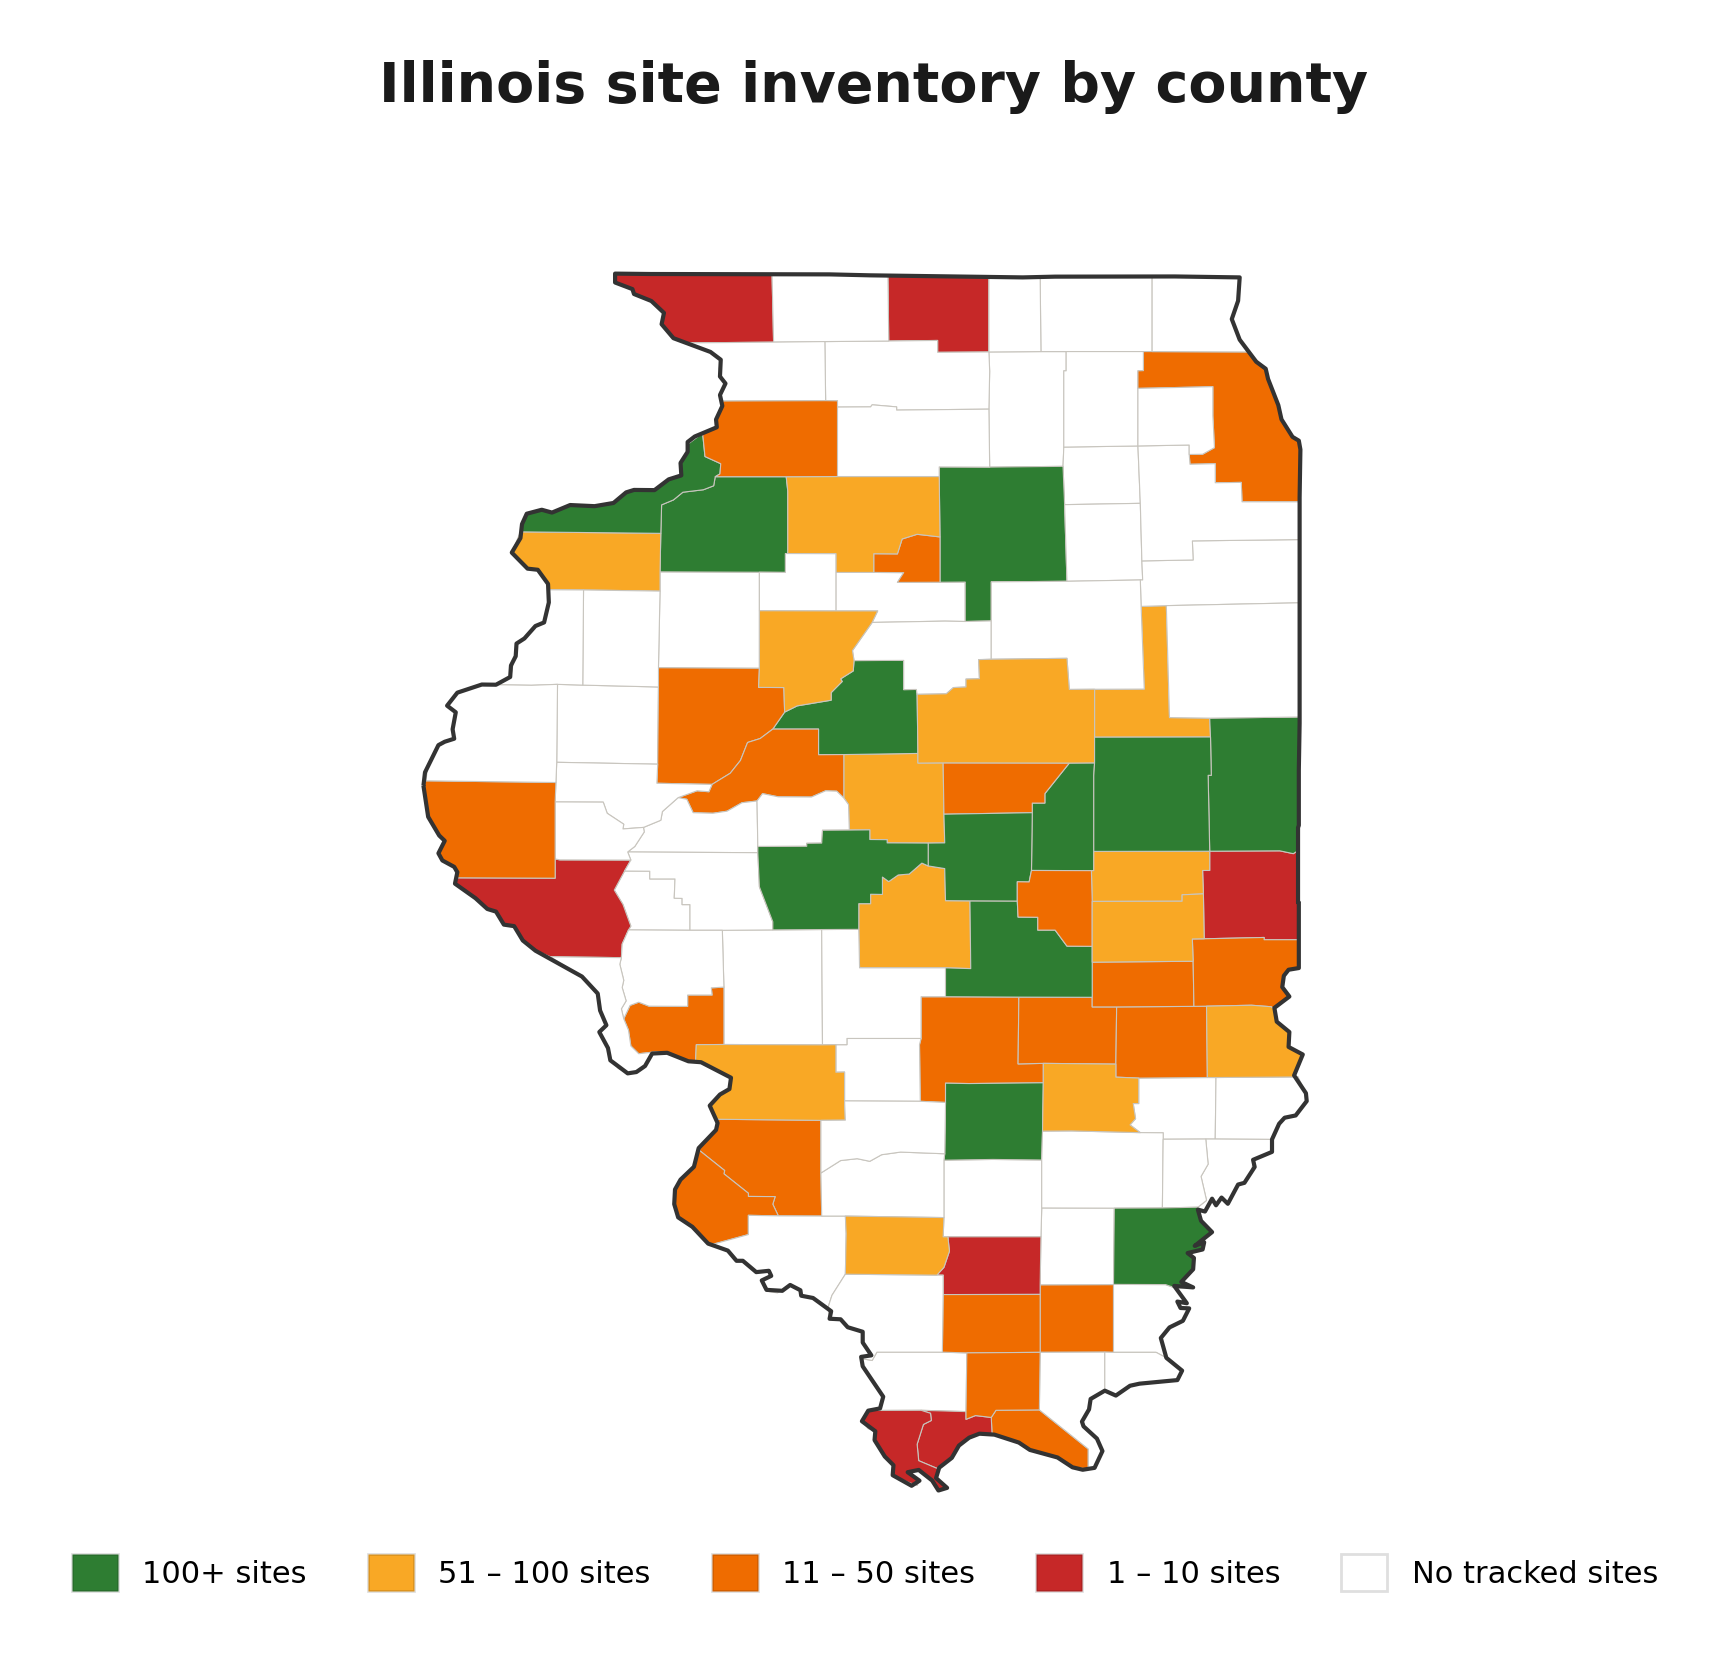
Illinois offers the broadest inventory in the MISO footprint, after Ohio, but its highest-quality and highest-volume counties are largely separate groups. Developers benefit from running both filters rather than relying on one: a quality-first screen will surface smaller counties with strong scores, while a volume-first screen will surface larger pipelines at moderate quality. That dynamic makes Illinois a state where pairing targets, combining a few high-score counties with a few high-volume counties, produces a stronger portfolio than optimizing for either metric alone.
Top 5 counties by average score

Top 5 counties by site volume

Site quality breakdown

Key takeaways for Illinois
- Illinois contains 3,595 tracked sites across MISO. 13.5% of sites (485) score 4.0 or above (Premium threshold).
- Franklin County leads in average site score (4.2) with 7 sites.
- Champaign County leads in total site volume (367 sites, avg score 3.2).
- Cumberland County (4.1 avg, 48 sites) offers the strongest combination of volume and premium-tier quality in the state.
Indiana
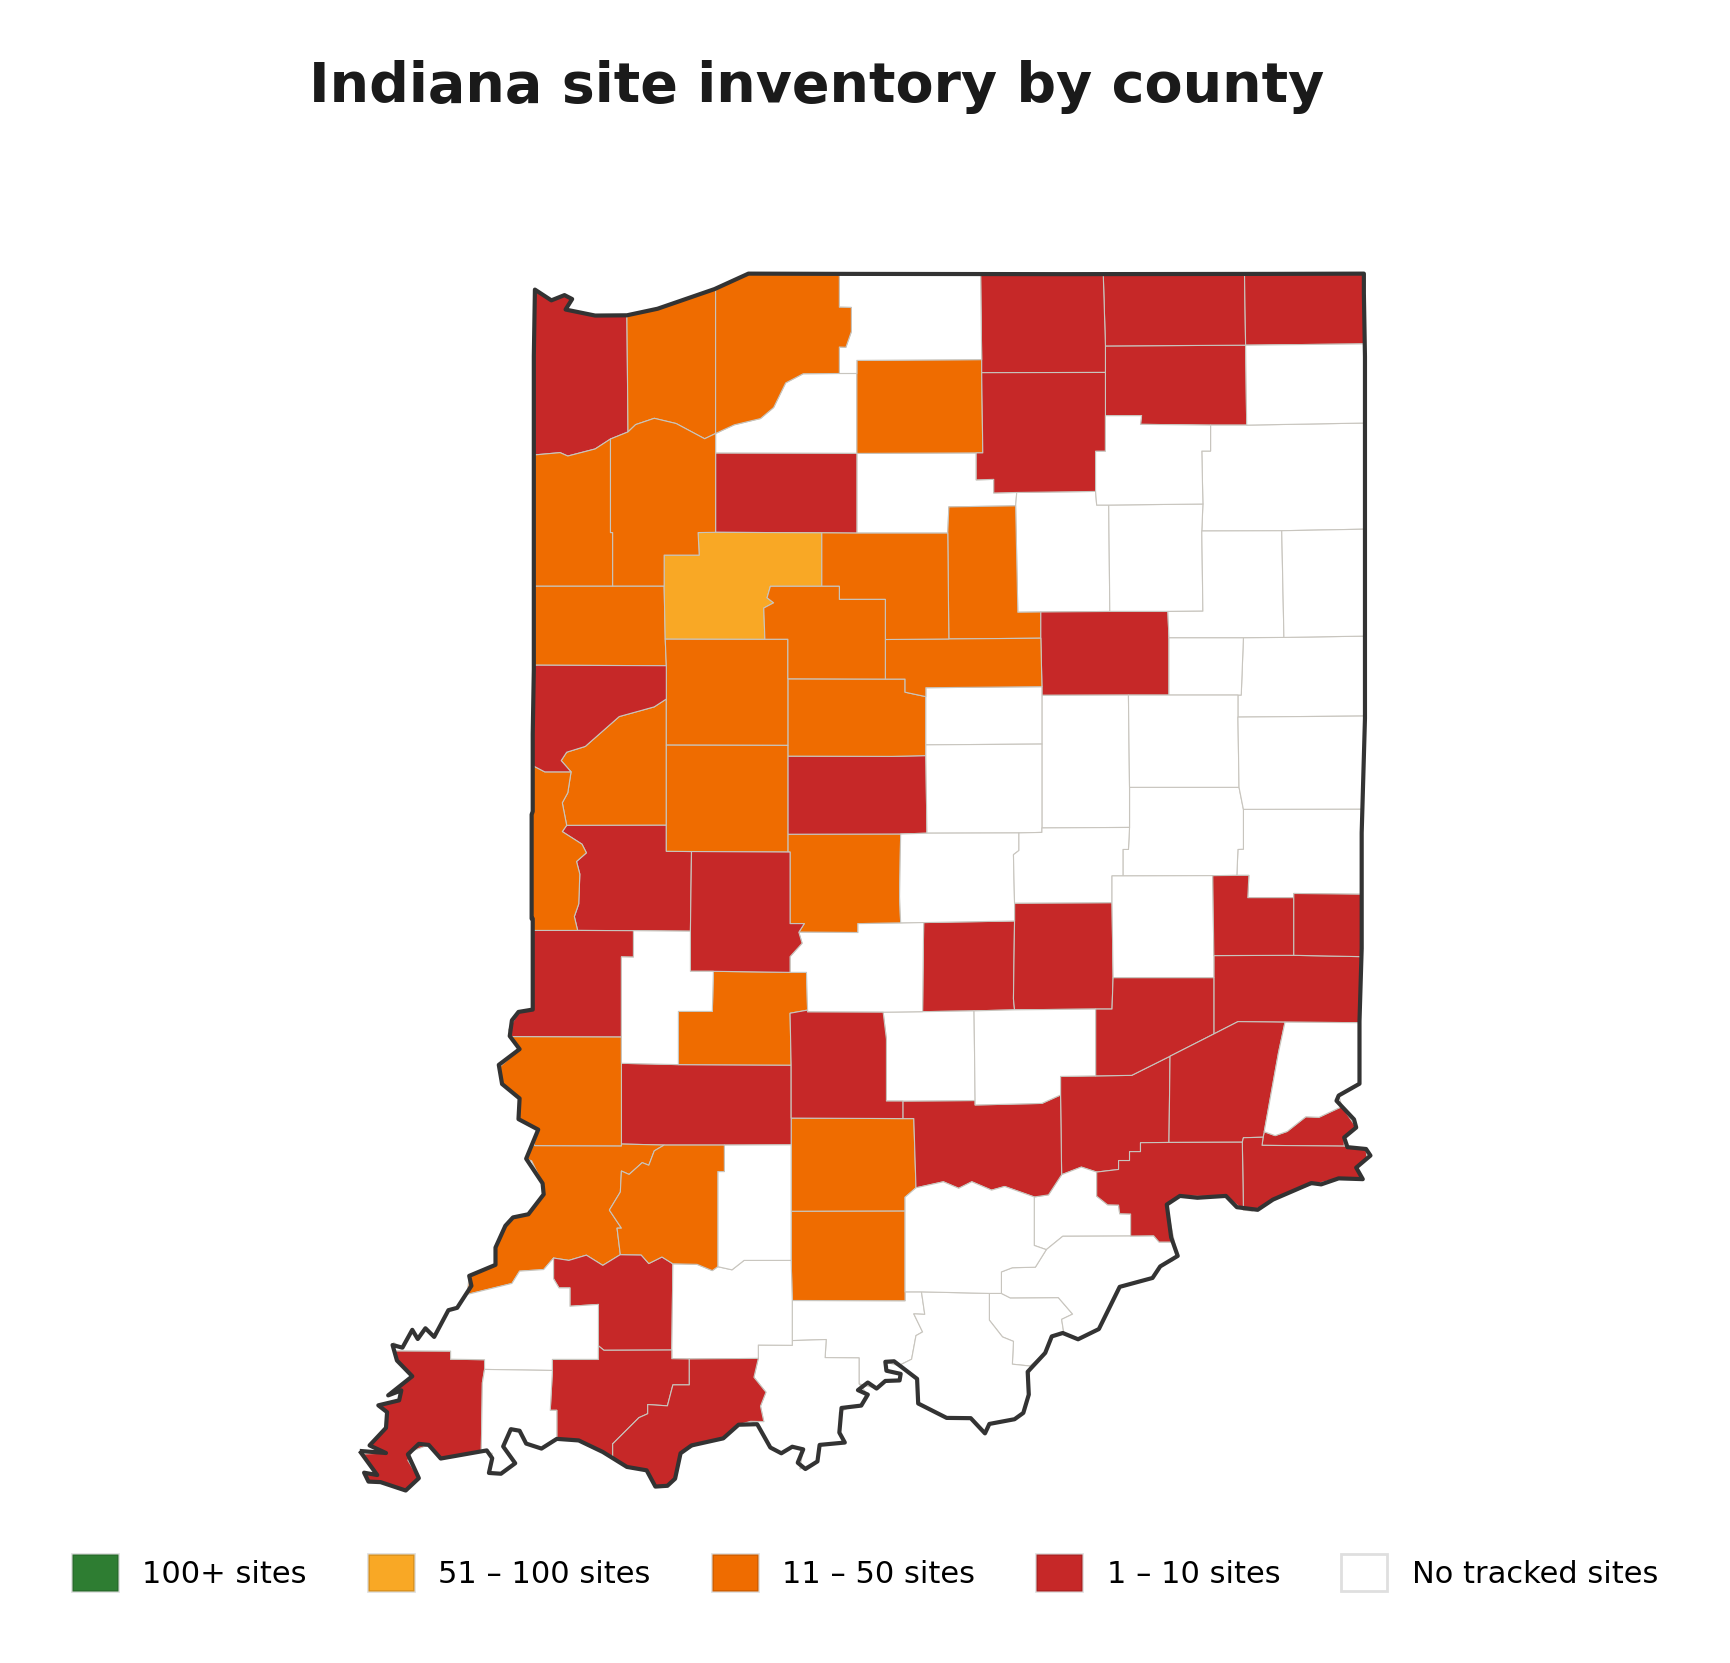
Indiana's February dataset applies updated MISO substation capacity data and refined parcel screening, contracting the site universe by nearly 20% and the premium tier by 38% relative to January. The result is a smaller but higher-confidence inventory, and any pipelines built from January figures need a fresh screen. The state's quality profile remains strong, with the highest acceptable-tier concentration (61.2%) among states in this report.
Top 5 counties by average score

Top 5 counties by site volume

Site quality breakdown

Indiana MoM change from Jan 2026 report

January to February: What changed and why
- Total sites: 898 (January) to 724 (February), a 19.4% contraction in one cycle.
- Premium sites: 183 (January) to 113 (February), down 38.3%. Premium rate fell from 20.4% to 15.6%.
- County leadership shifted: January showed LaPorte, Kosciusko, and Porter leading premium inventory. February shows Vigo (4.4), LaPorte (4.3), and Elkhart (4.2) at the top by average score, with White County (54 sites) leading volume.
- Any developer who built a pipeline from the January report should re-screen. Sites that scored premium in January may no longer qualify under the updated dataset.
Key takeaways for Indiana
- Indiana contains 724 tracked sites across MISO. 15.6% of sites (113) score 4.0 or above (Premium threshold).
- Vigo County leads in average site score (4.4) with 1 site.
- White County leads in total site volume (54 sites, avg score 3.8).
- February site counts reflect updated MISO capacity data and refined parcel screening relative to January. Developers with January pipelines should re-screen.
Missouri
Missouri rounds out the four-state MISO analysis as the most selective market. While Ohio, Illinois, and Indiana offer broad county-level targeting opportunities, Missouri rewards a different approach: disciplined, parcel-by-parcel screening across a thinner pipeline. For developers willing to do that granular work, the state still offers meaningful MISO-connected inventory, but expectations around hit rates and county-level filtering should be calibrated accordingly.

Top 5 counties by average score

Top 5 counties by site volume

Site quality breakdown

Key takeaways for Missouri
- Missouri contains 907 tracked sites across MISO. 5.3% of sites (48) score 4.0 or above (Premium threshold), the lowest premium rate of any state in this report.
- Phelps County leads in average site score (3.9) with 40 sites. No county averages 4.0 or above.
- Audrain County leads in total site volume (163 sites, avg score 3.2).
- No county clears the 4.0 Premium threshold on average. Premium parcels are distributed individually across the state, requiring parcel-level screening rather than county-level filtering.
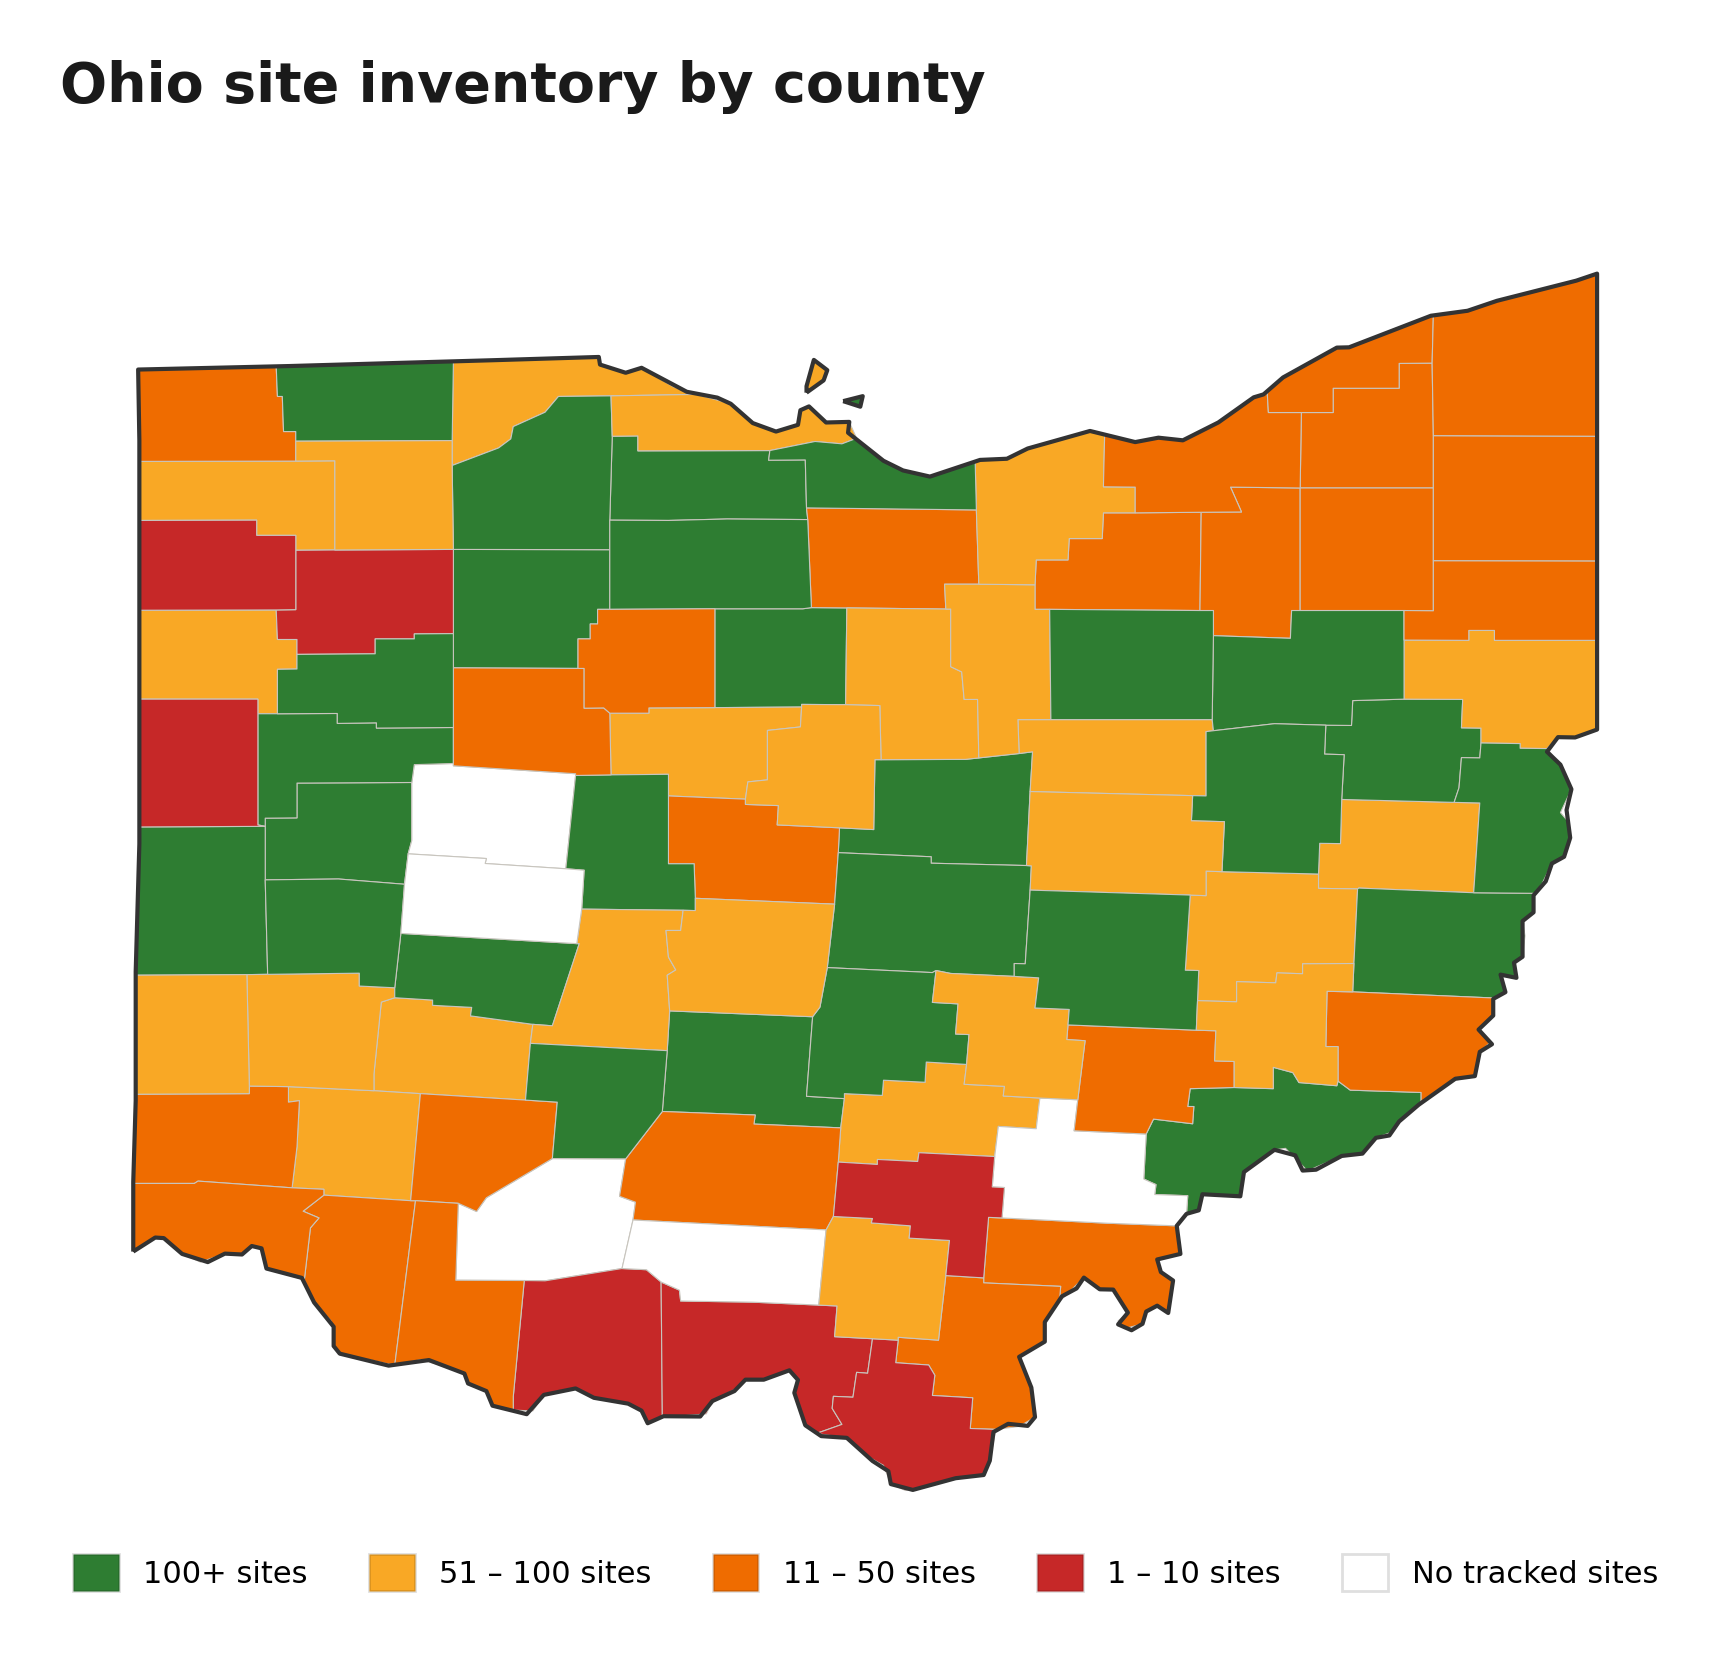
Ohio
Ohio is the deepest market in this report, offering roughly 2,000 more tracked sites than the next largest state. That depth translates to real geographic optionality: no single county dominates, and developers can build diversified pipelines across multiple corridors without exhausting supply. A critical caveat: Ohio's site scores are based on PJM RTEP25 Summer Peak 2030 capacity projections. Today, much of the state's grid is heavily constrained, and the capacity reflected in these scores does not yet exist.
Top 5 counties by average score

Top 5 counties by site volume

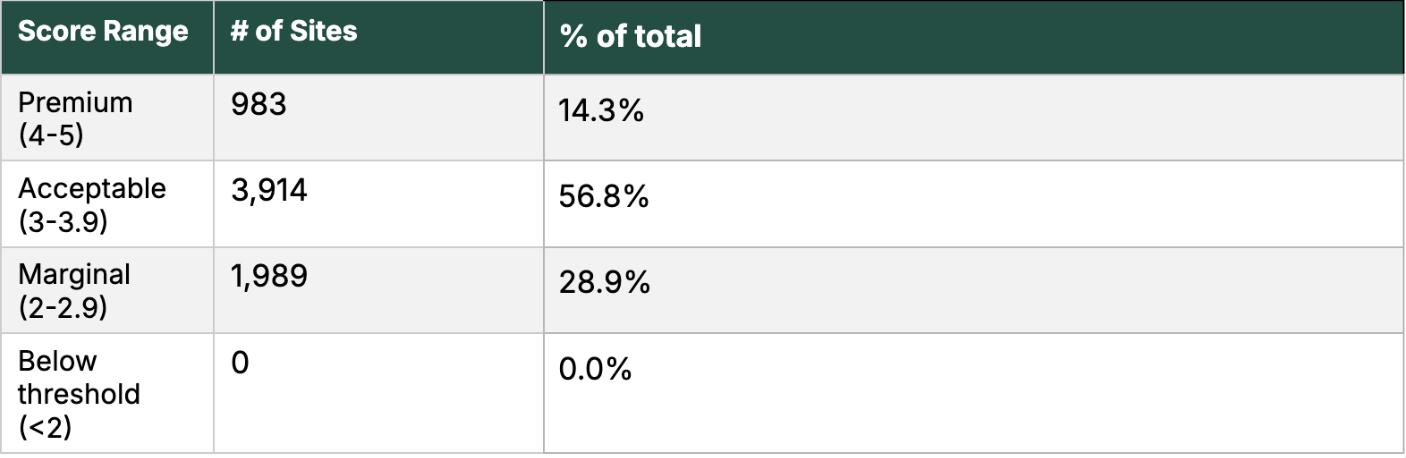
Site quality breakdown
Key takeaways for Ohio
- Ohio contains 6,886 tracked sites, the most of any state in this report. 14.3% of sites (983) score 4.0 or above (Premium threshold).
- Adams County leads in average site score (4.2) with 7 sites.
- Fayette County leads in total site volume (164 sites, avg score 2.9).
- Van Wert County stands out as the strongest dual-signal county, ranking in the top 5 for both quality (4.0 avg) and volume with 90 sites.
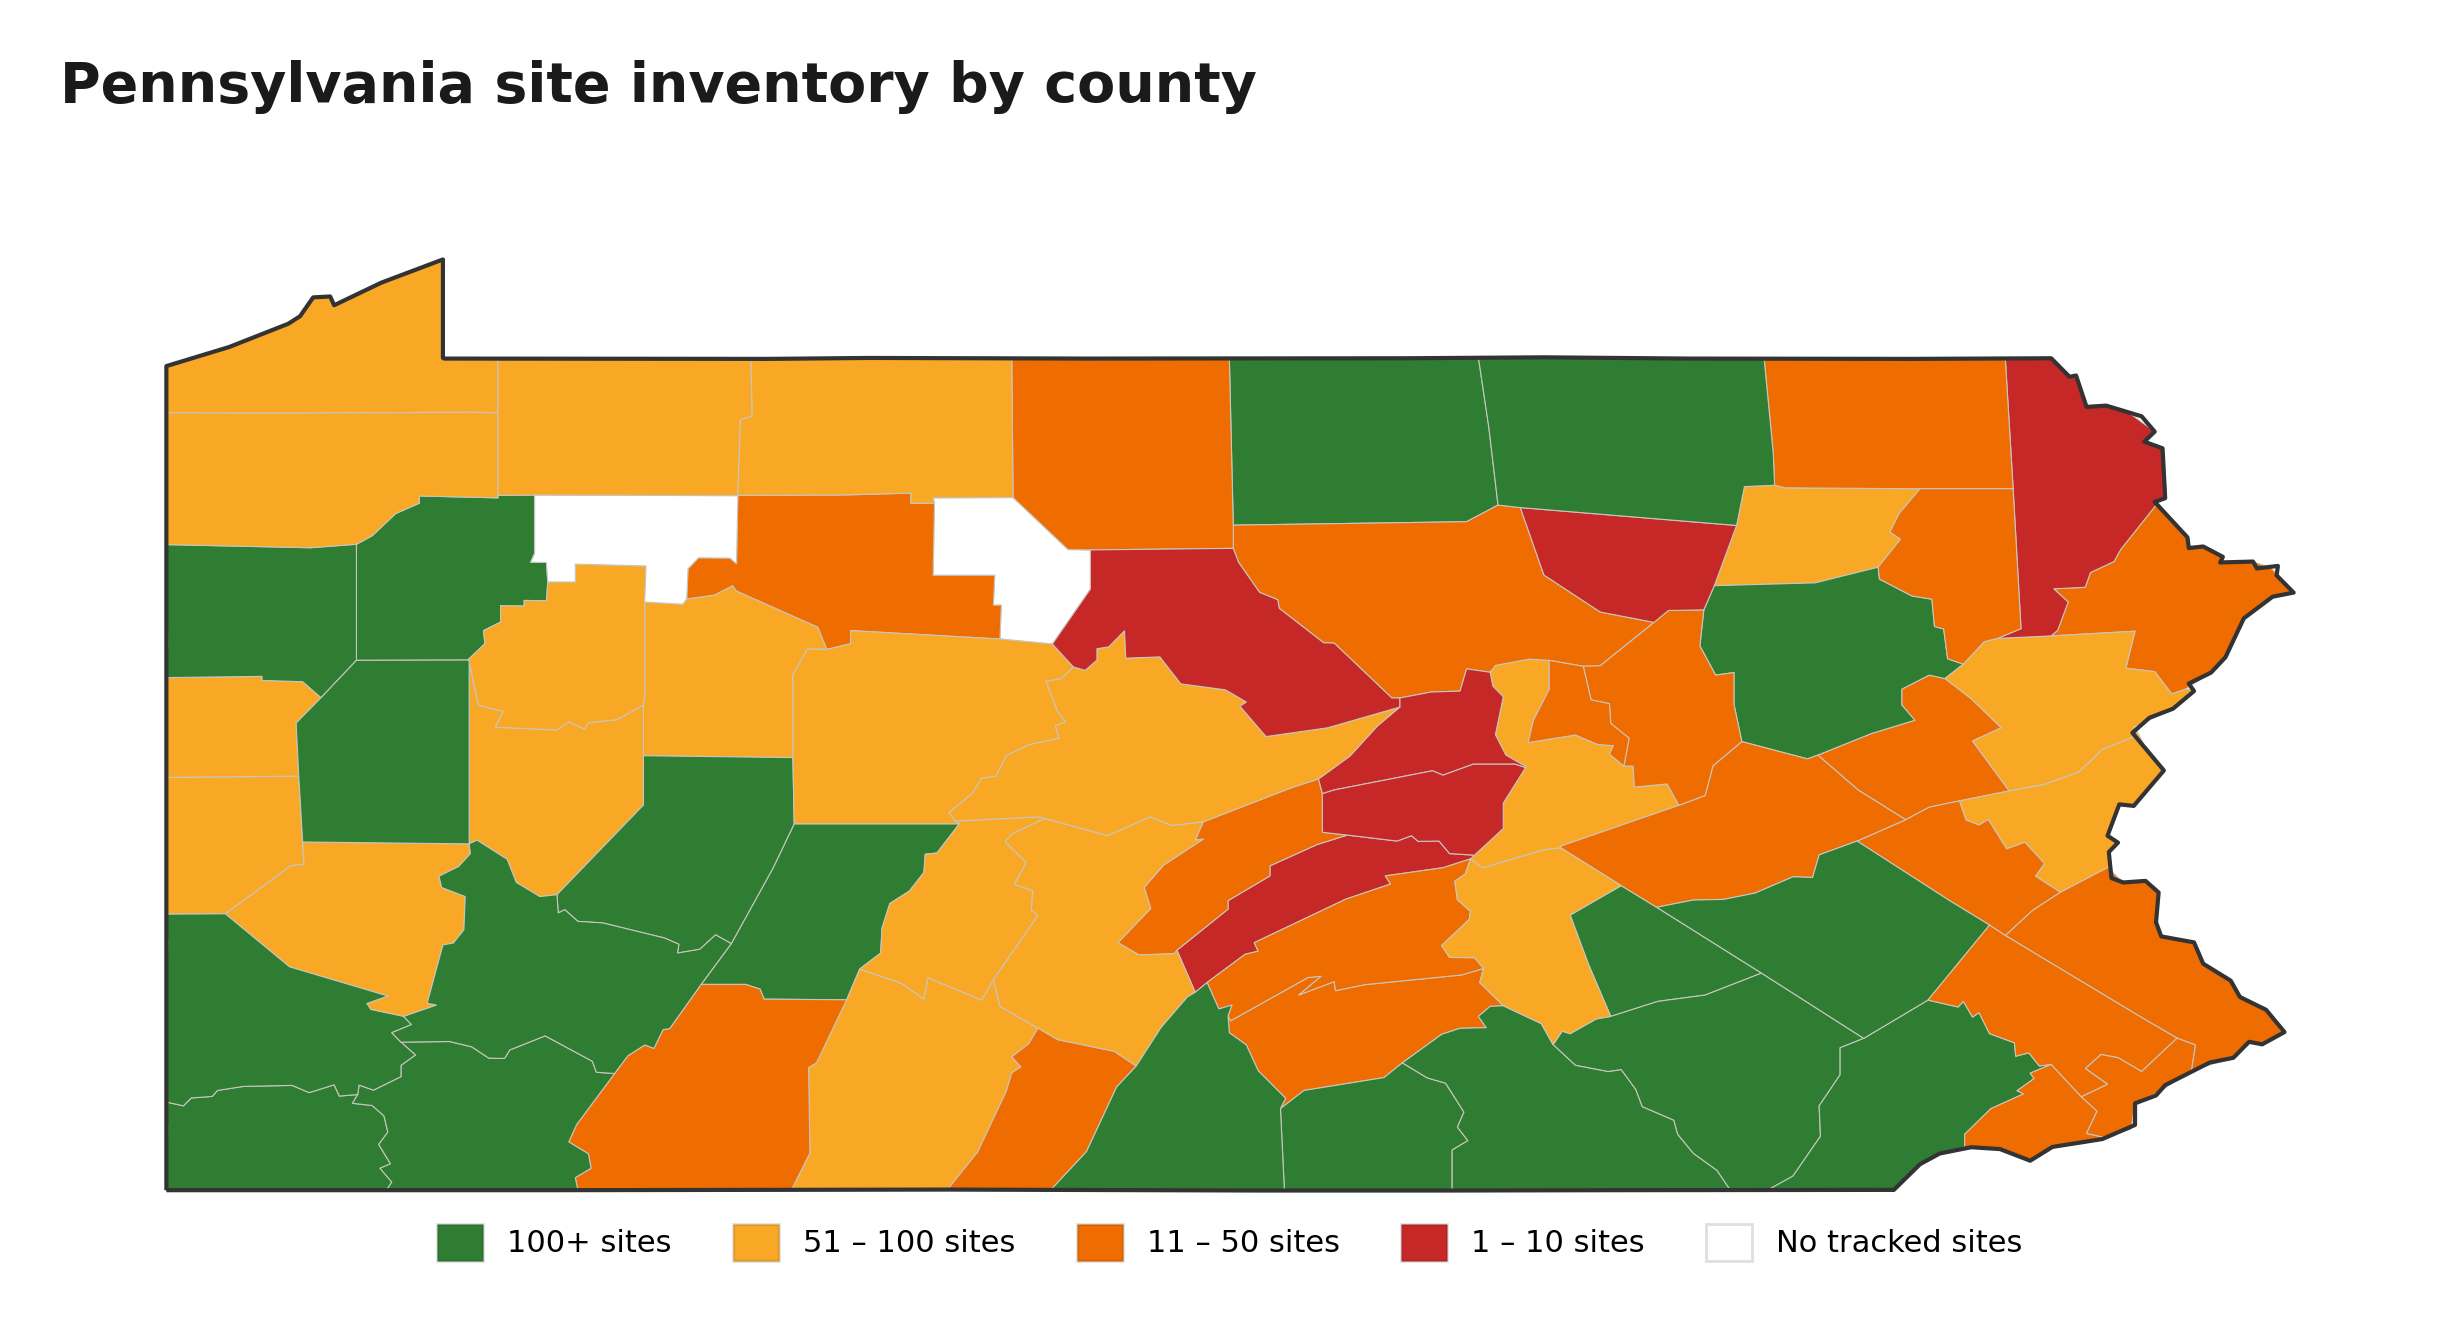
Pennsylvania
Pennsylvania pairs the second-largest site inventory in the report with a premium rate that rivals the MISO-leading states, making it a strong option for developers seeking PJM grid access at scale. The state also shows an unusual quality-volume balance: its top-volume counties, like Indiana and Washington, carry above-average scores rather than the quality dropoff that typically accompanies high-count counties in other states.
Top 5 counties by average score

Top 5 counties by site volume

Site quality breakdown

Key takeaways for Pennsylvania
- Pennsylvania contains 4,954 tracked sites across PJM. 15.1% of sites (746) score 4.0 or above (Premium threshold).
- Lackawanna County leads in average site score (4.2) with 35 sites.
- Indiana County leads in total site volume (246 sites, avg score 3.4).
- Snyder County (4.1 avg, 10 sites) and Pike County (4.0 avg, 14 sites) round out the premium-quality tier. Indiana County's above-average score of 3.4 makes it the strongest dual-signal county in the state.
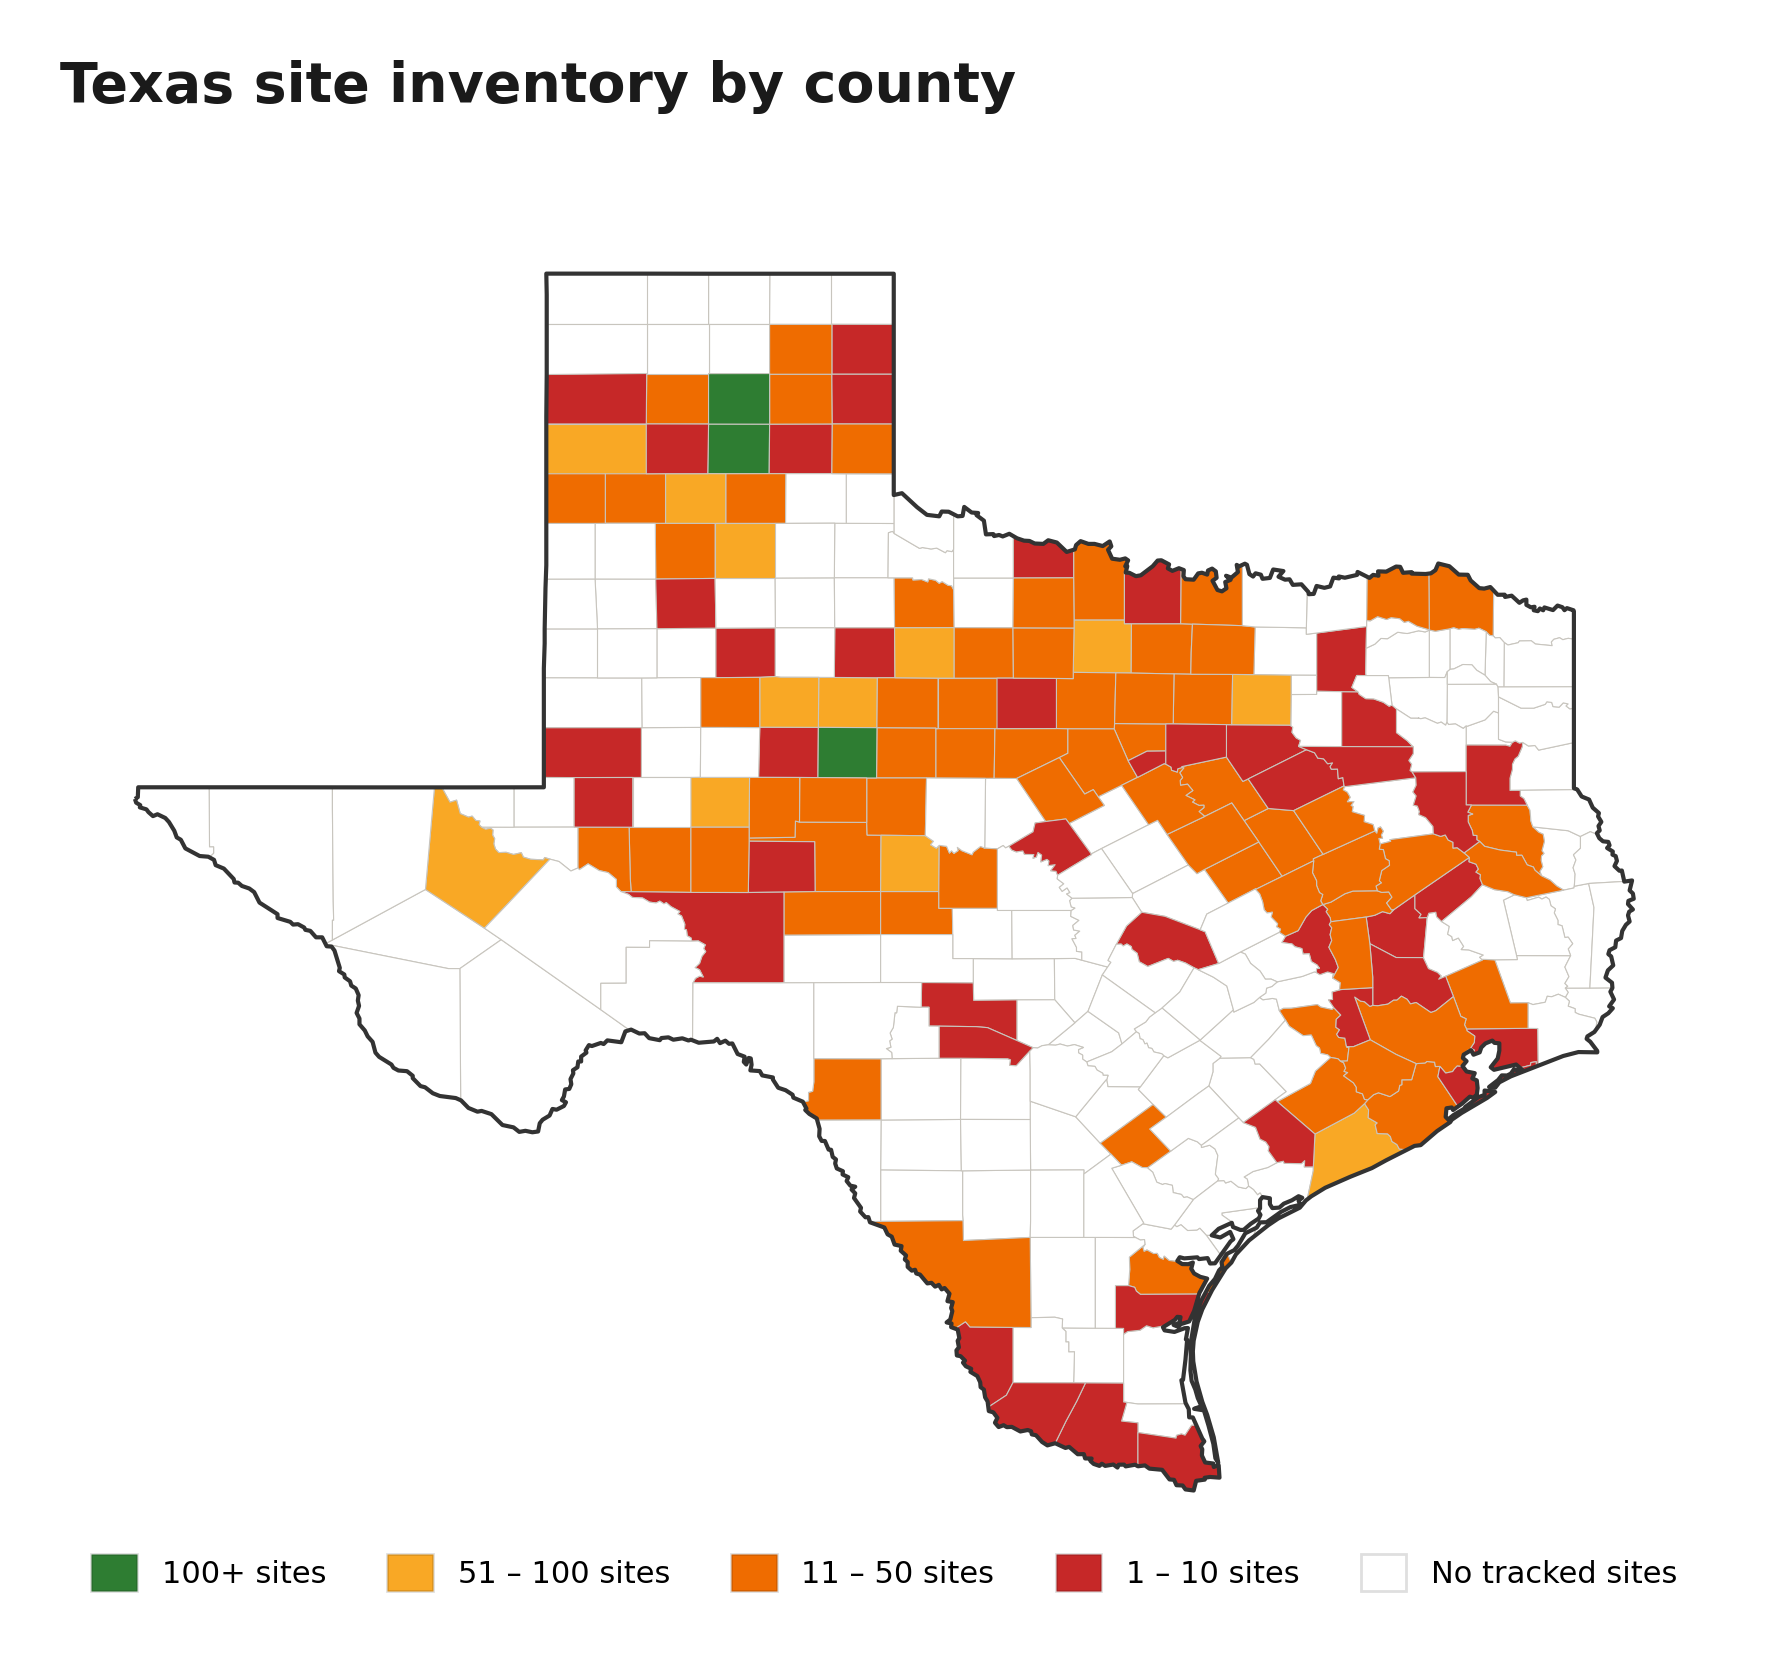
Texas
Texas operates on a fundamentally different quality curve than the MISO and PJM states in this report, with a 33.8% premium rate that significantly exceeds that of the next-closest state. The ERCOT grid also shows a pattern the other states don't: its highest-volume counties carry premium-tier scores, meaning developers can target scale and quality simultaneously rather than trading one for the other. However, total inventory has contracted roughly 11% since January, continuing a decline dating back to mid-2025, so the window for site selection is narrowing.
Top 5 counties by average score

Top 5 counties by site volume

Site quality breakdown

Texas MoM change from Jan 2026 report

January to February: Inventory contraction continues
- Total sites: 3,297 (January) to 2,938 (February), a 10.9% decline in one cycle.
- The January report flagged a steady decline in available Texas sites dating back to July 2025. The February data is consistent with that trajectory. Premium inventory is proving more durable than lower-quality supply, but total site counts continue to fall.
- Premium sites held roughly flat as a share: approximately 33%+ in January vs 33.8% in February. The inventory leaving the pool is concentrated in marginal and acceptable tiers, not premium.
- Top quality counties are consistent across both months: Andrews, Irion, Crockett, and the West Texas region dominate the score rankings. Carson County remains the volume leader.
- Developers who identified target counties in January should move quickly. The window for premium site selection in established ERCOT markets is narrowing each cycle.
Key takeaways for Texas
- Carson County leads volume with 204 sites averaging 4.1, a proven ERCOT deployment zone.
- Andrews County tops the quality ranking at 4.6.
- Armstrong (104 sites, 3.6) and Nolan (103 sites, 3.9) are strong dual-market candidates.
- Deaf Smith County stands out as a premium-volume leader with 99 sites averaging 4.2.
Virginia
While Virginia carries the second-highest premium rate in this report at 21.0%, trailing only Texas's ERCOT-driven 33.8%, note this is based on a later year’s capacity data (the RTEP25 Summer Peak 2030). What distinguishes Virginia is that its premium inventory isn't limited to small, low-volume counties: Brunswick County carries 127 sites at a 4.2 average, and Fauquier anchors the volume list at exactly the 4.0 premium threshold. However, developers should weigh these scores against the current grid reality. Virginia's PJM capacity data is based on RTEP25 Summer Peak 2030 projections, and the state's grid is among the most constrained in the country today. The scores in this report reflect where capacity is expected to open up, not where it exists now. PJM's flexibility as an RTO provides a longer-term tailwind, but near-term site availability is significantly more competitive than raw scores suggest.

Top 5 counties by average score

Top 5 counties by site volume

Site quality breakdown

Key takeaways for Virginia
- Virginia contains 3,788 tracked sites across PJM. 21.0% of sites (795) score 4.0 or above (Premium threshold), the highest premium rate among all seven states.
- Hopewell leads in average site score (4.7) with 2 sites.
- Mecklenburg County leads in total site volume (250 sites, avg score 3.1).
- Brunswick County stands out with 127 sites averaging 4.2, the best combination of volume and premium quality in the state. Fauquier County (147 sites, avg 4.0) anchors the volume list at the Premium threshold.
How to stay ahead
The 23,792 sites tracked across seven states represent a snapshot, and one that will look materially different in thirty days. Indiana's 19.4% inventory contraction in a single cycle is clear proof that point-in-time site screening is insufficient for developers making real capital allocation decisions. The sites available today will not all be available next month.
County-level data is where the action is. State averages hide dramatic local variation: Virginia’s 21.0% premium rate means nothing if your team is screening in a county where only 8% of sites are premium. Missouri’s apparently thin market becomes more tractable when narrowed to the Kansas City metro. Ohio’s 6,886 sites only matter if you know which 500 to look at first.
Virginia, Pennsylvania, Ohio, Missouri, Illinois, Indiana, and Texas represent a substantial share of current U.S. hyperscale and colocation development activity. Together, the seven states hold 23,792 sites, 4,164 of which meet the premium threshold that most serious developers use as a first filter.
This analysis is one layer of a multi-layer decision. Infrastructure scores tell you where power and connectivity align. They do not tell you whether a county will permit a data center, whether community opposition will delay or block a project, or whether a competing developer has already secured the best parcels. Paces offers permitting risk analysis, community sentiment scoring, and competitive intelligence that complement this infrastructure view. Developers who layer those inputs on top of site scores are the ones closing deals, not just building pipelines.
Find the right sites faster
Subscribe to the Paces monthly report to receive updated county-level site intelligence for all seven states as each cycle publishes. Ready to get to the site-level and see this data across every state? Book a demo to go deeper and learn about custom screening, real-time data access, and bespoke market analysis.
Sign up for emails
Find the right sites faster, assess feasibility with world class data, and track progress across your entire project pipeline with software built to compress your workflow.