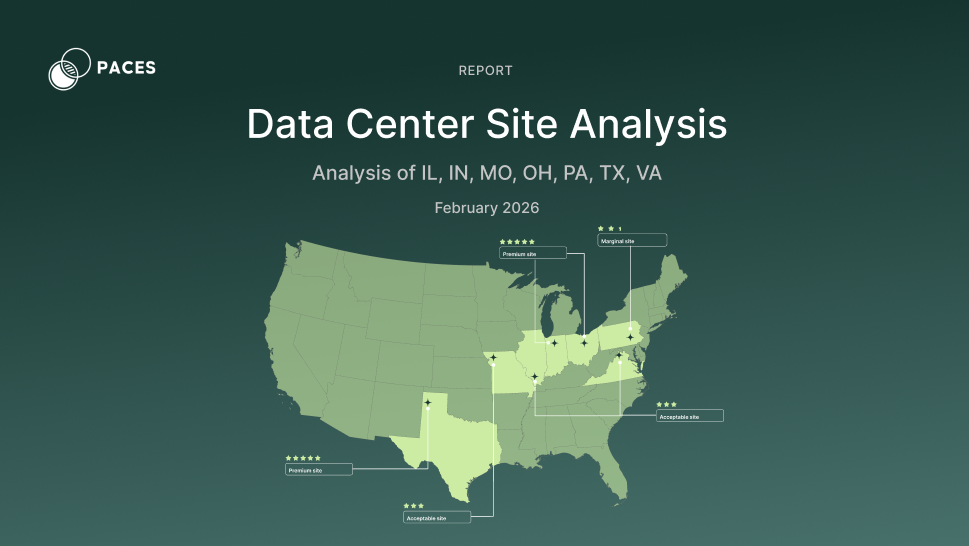
Data Center Site Analysis: March 2026
The Paces Data Center Site Analysis series provides a county-level view of site availability and quality across key markets. By tracking how withdrawal capacity and site scores evolve month-over-month, developers can identify opportunities before they disappear and understand which markets are gaining or losing viable inventory before going deeper in a site search. Sign up for our email, so you can be the first to know about new market assessments every month.
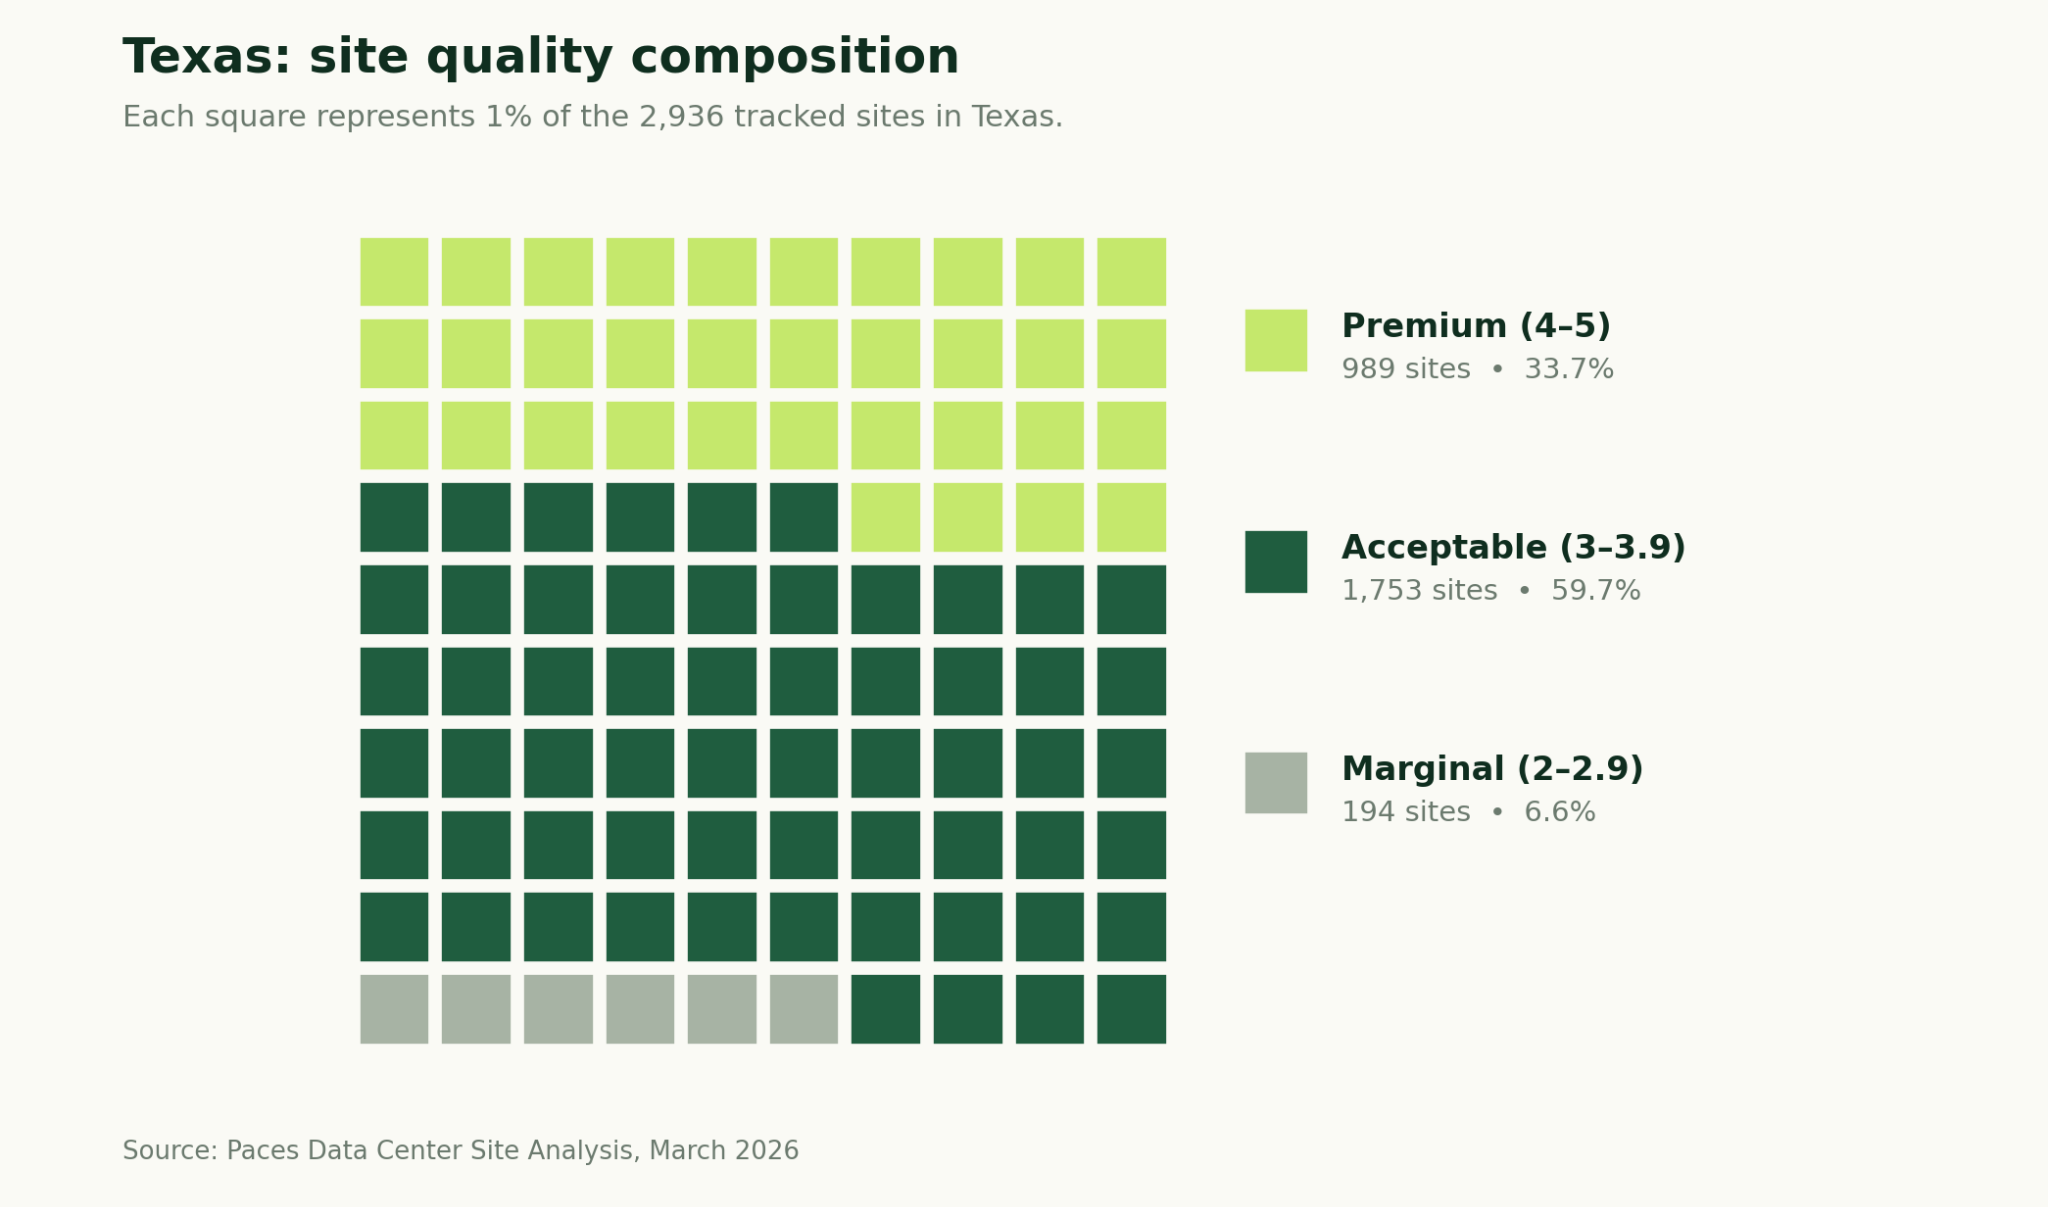
This March 2026 report is our third installment and expands to ten states, adding Iowa, Oklahoma, and North Carolina to the seven previously covered. Across all ten states, Paces tracks 35,517 total sites, of which 5,531 meet the Premium threshold (score 4.0 or above). Texas continues to lead in premium concentration at 33.7%, Ohio leads in raw site volume with 6,744 sites, and Virginia leads the PJM corridor in premium rate at 20.4%. Among the returning seven states, inventories declined modestly across the board — with Pennsylvania seeing the largest contraction (-7.1%) — while Texas effectively stabilized after months of consistent drawdown.
Because seven states were covered in the February 2026 report, they include month-over-month comparison sections with data tables tracking changes in total sites, premium counts, and county leadership. The three additional states — Iowa, Oklahoma, and North Carolina — are new to this edition and will have comparison data in future reports.
Enter your email to continue reading
*Our methodology is covered in full below, but it's important to note that all scores focus on infrastructure and maximum withdrawal capacity and do not account for permitting, community sentiment, and other risks, which further impact the viability of sites. Additionally, each state's withdrawal capacity is evaluated by future ISO/utility capacity projections. Virginia, Ohio, and Pennsylvania scores are based on PJM capacity projections for Summer Peak 2030, not currently available capacity, and both states are heavily grid-constrained today. For a complete and deeper picture, contact Paces.
Methodology
How we score every site
This report analyzes data center siting opportunities across 10 states as of March 2026 to determine where sites with a viable path to power are located. We perform a bottom-up analysis of on- and off-market sites, evaluating comprehensive infrastructure and location factors that directly impact development feasibility.
Data center score components
Our Data Center Score evaluates each site on eight critical factors, with scores ranging from 1–5 (5 being optimal):
- Total buildable acreage
- Maximum continuous buildable acreage
- Distance to transmission lines
- Voltage of transmission lines (kV)
- Distance to fiber infrastructure
- Distance to population centers (200K+)
- Distance to gas pipelines (10"+ diameter, Texas only)
- Maximum withdrawal capacity (MW) from nearby substations, based on:
- Indiana: MISO Withdrawal Capacity (MTEP25AA Summer Peak 2027
- Texas: ERCOT Withdrawal Capacity (SSWG25 Summer Peak 2028
- Virginia, Ohio, Pennsylvania, North Carolina: PJM (RTEP25 Summer Peak 2030
- Missouri, Illinois, and Iowa: MISO (MTEP25AA Summer Peak 2030
- Oklahoma: SPP (2026ITP30S)
How we weight the variables
Our scoring methodology prioritizes the factors that most directly impact development feasibility:
- 50% weight: Grid capacity
- 20% weight: Grid infrastructure
- 15% weight: Site size & buildability
- 15% weight: Other infrastructure and workforce
Sites with insufficient interconnection capacity face extended timelines and significant costs for grid upgrades regardless of how well they score on other metrics, which is why it carries the heaviest weight in our analysis.
Each site then receives an independent score from 1–5, allowing developers to identify absolute quality rather than relative rankings. Sites are not scored against each other: a score of 4.5 represents the same level of readiness regardless of which state or county it's in.
Score ranges
To simplify market analysis, we group sites into ranges based on their final scores:
- 4–5: Premium sites with optimal infrastructure and power capacity
- 3–3.9: Acceptable development opportunities with good fundamentals
- 2–2.9: Marginal sites requiring additional infrastructure investment
- Below 2: Below development threshold for most projects
Key findings: The ten-state landscape
In March 2026, across ten states, Paces tracks 35,517 total sites. Texas leads in premium concentration (33.7%), Ohio and Oklahoma deliver the largest raw site volumes (6,744 and 6,335 respectively), and Missouri remains the most constrained market with a 5.3% premium rate. Iowa and Oklahoma enter the report as major additions to the inventory picture: Iowa contributes 5,269 sites to the MISO footprint, and Oklahoma adds 6,335 sites across SPP. Among returning states, Pennsylvania saw the most significant inventory decline (-7.1%), while Texas stabilized near its February levels. Indiana posted the most stable performance of any returning state, holding flat in both total and premium site counts.
Ten-state summary: March 2026
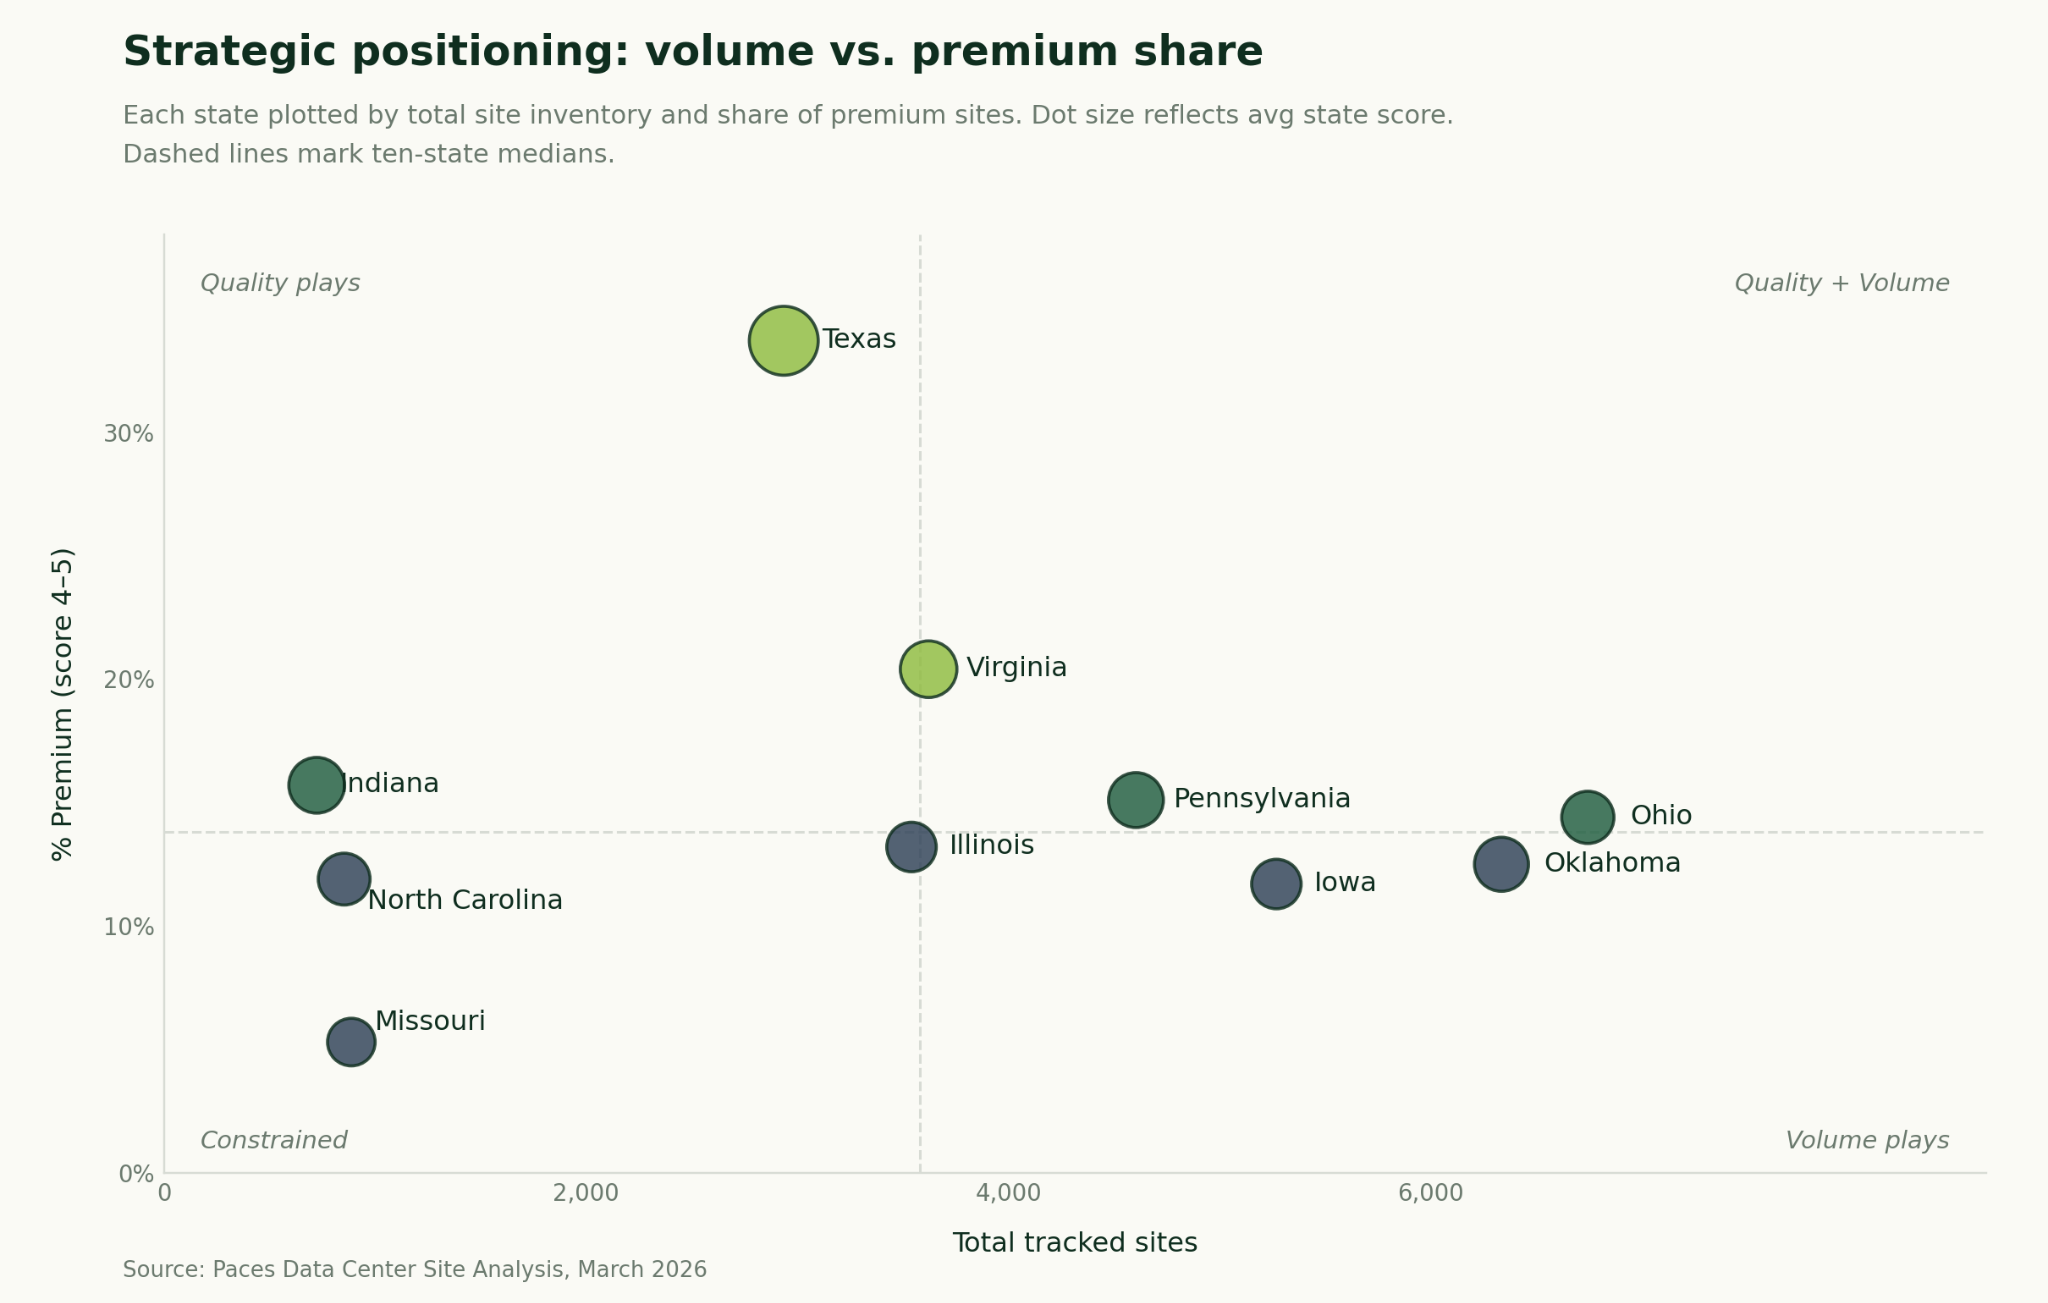
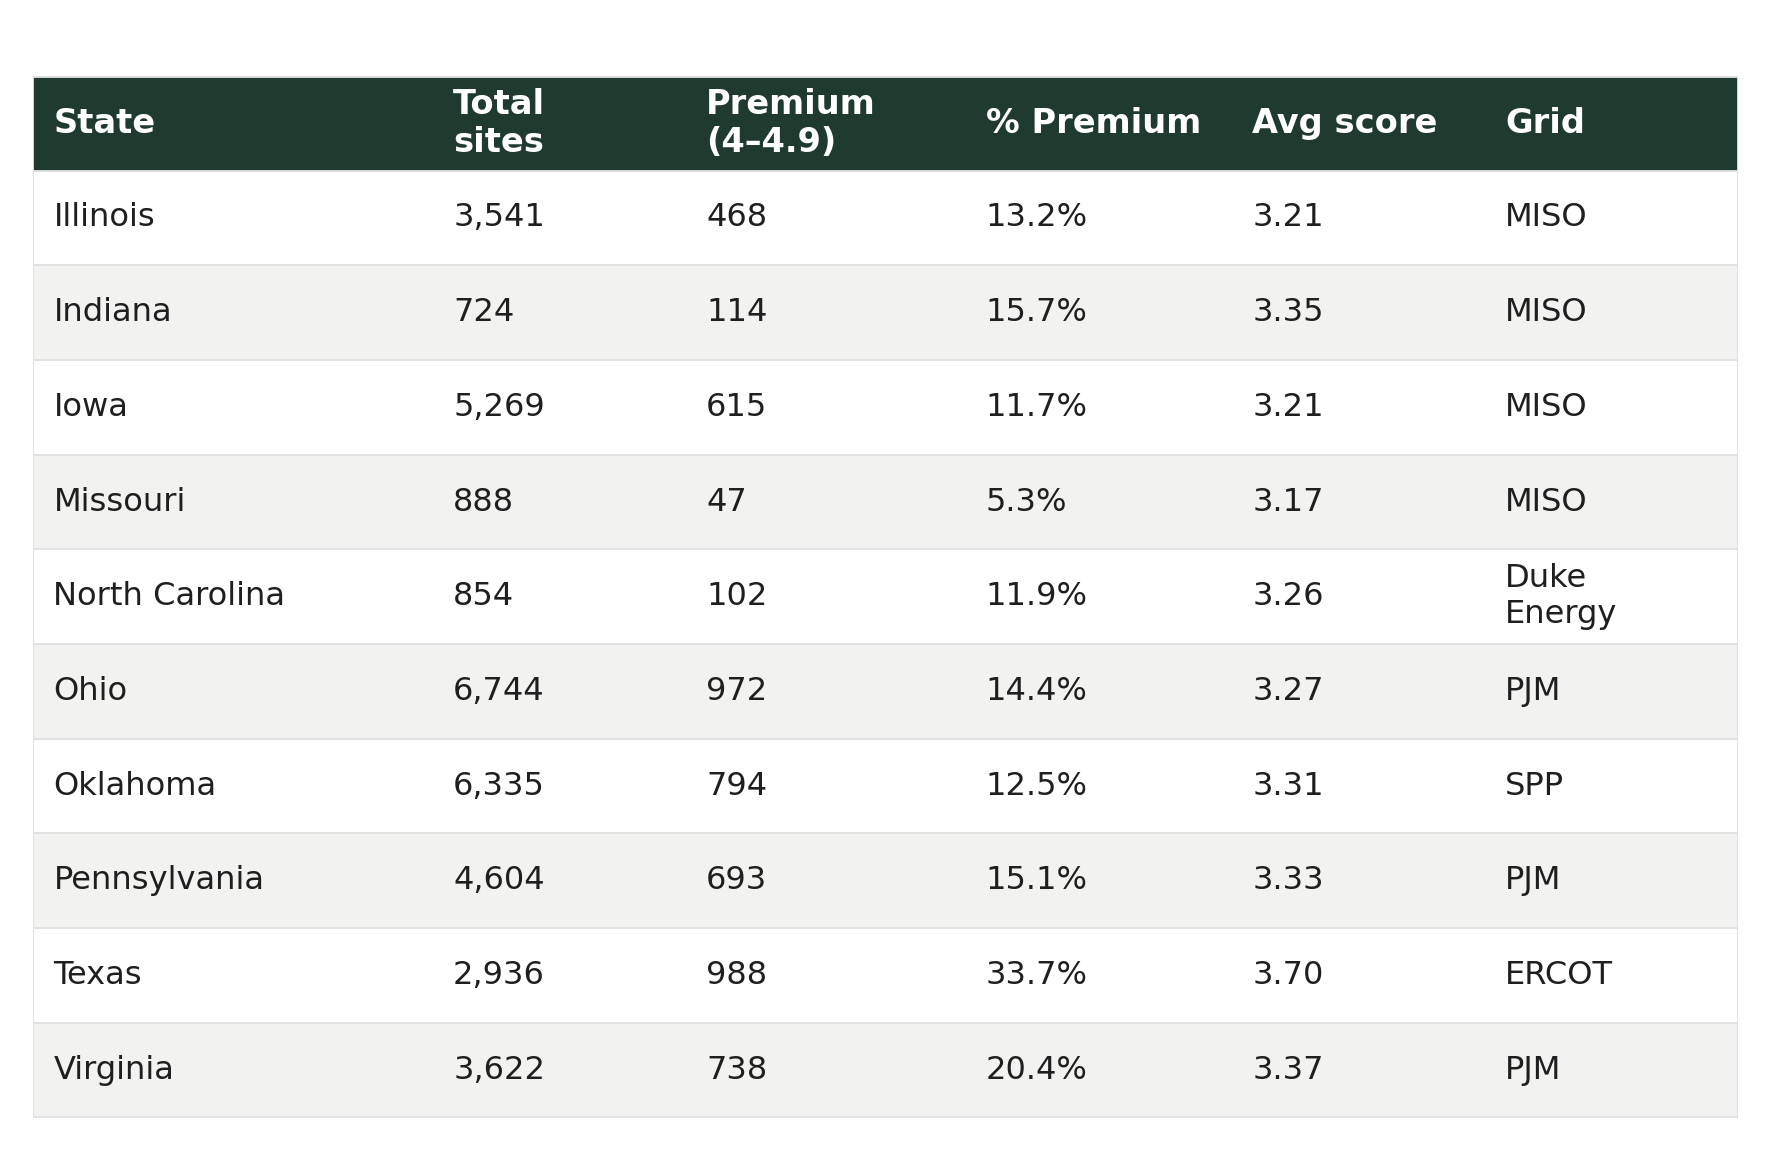
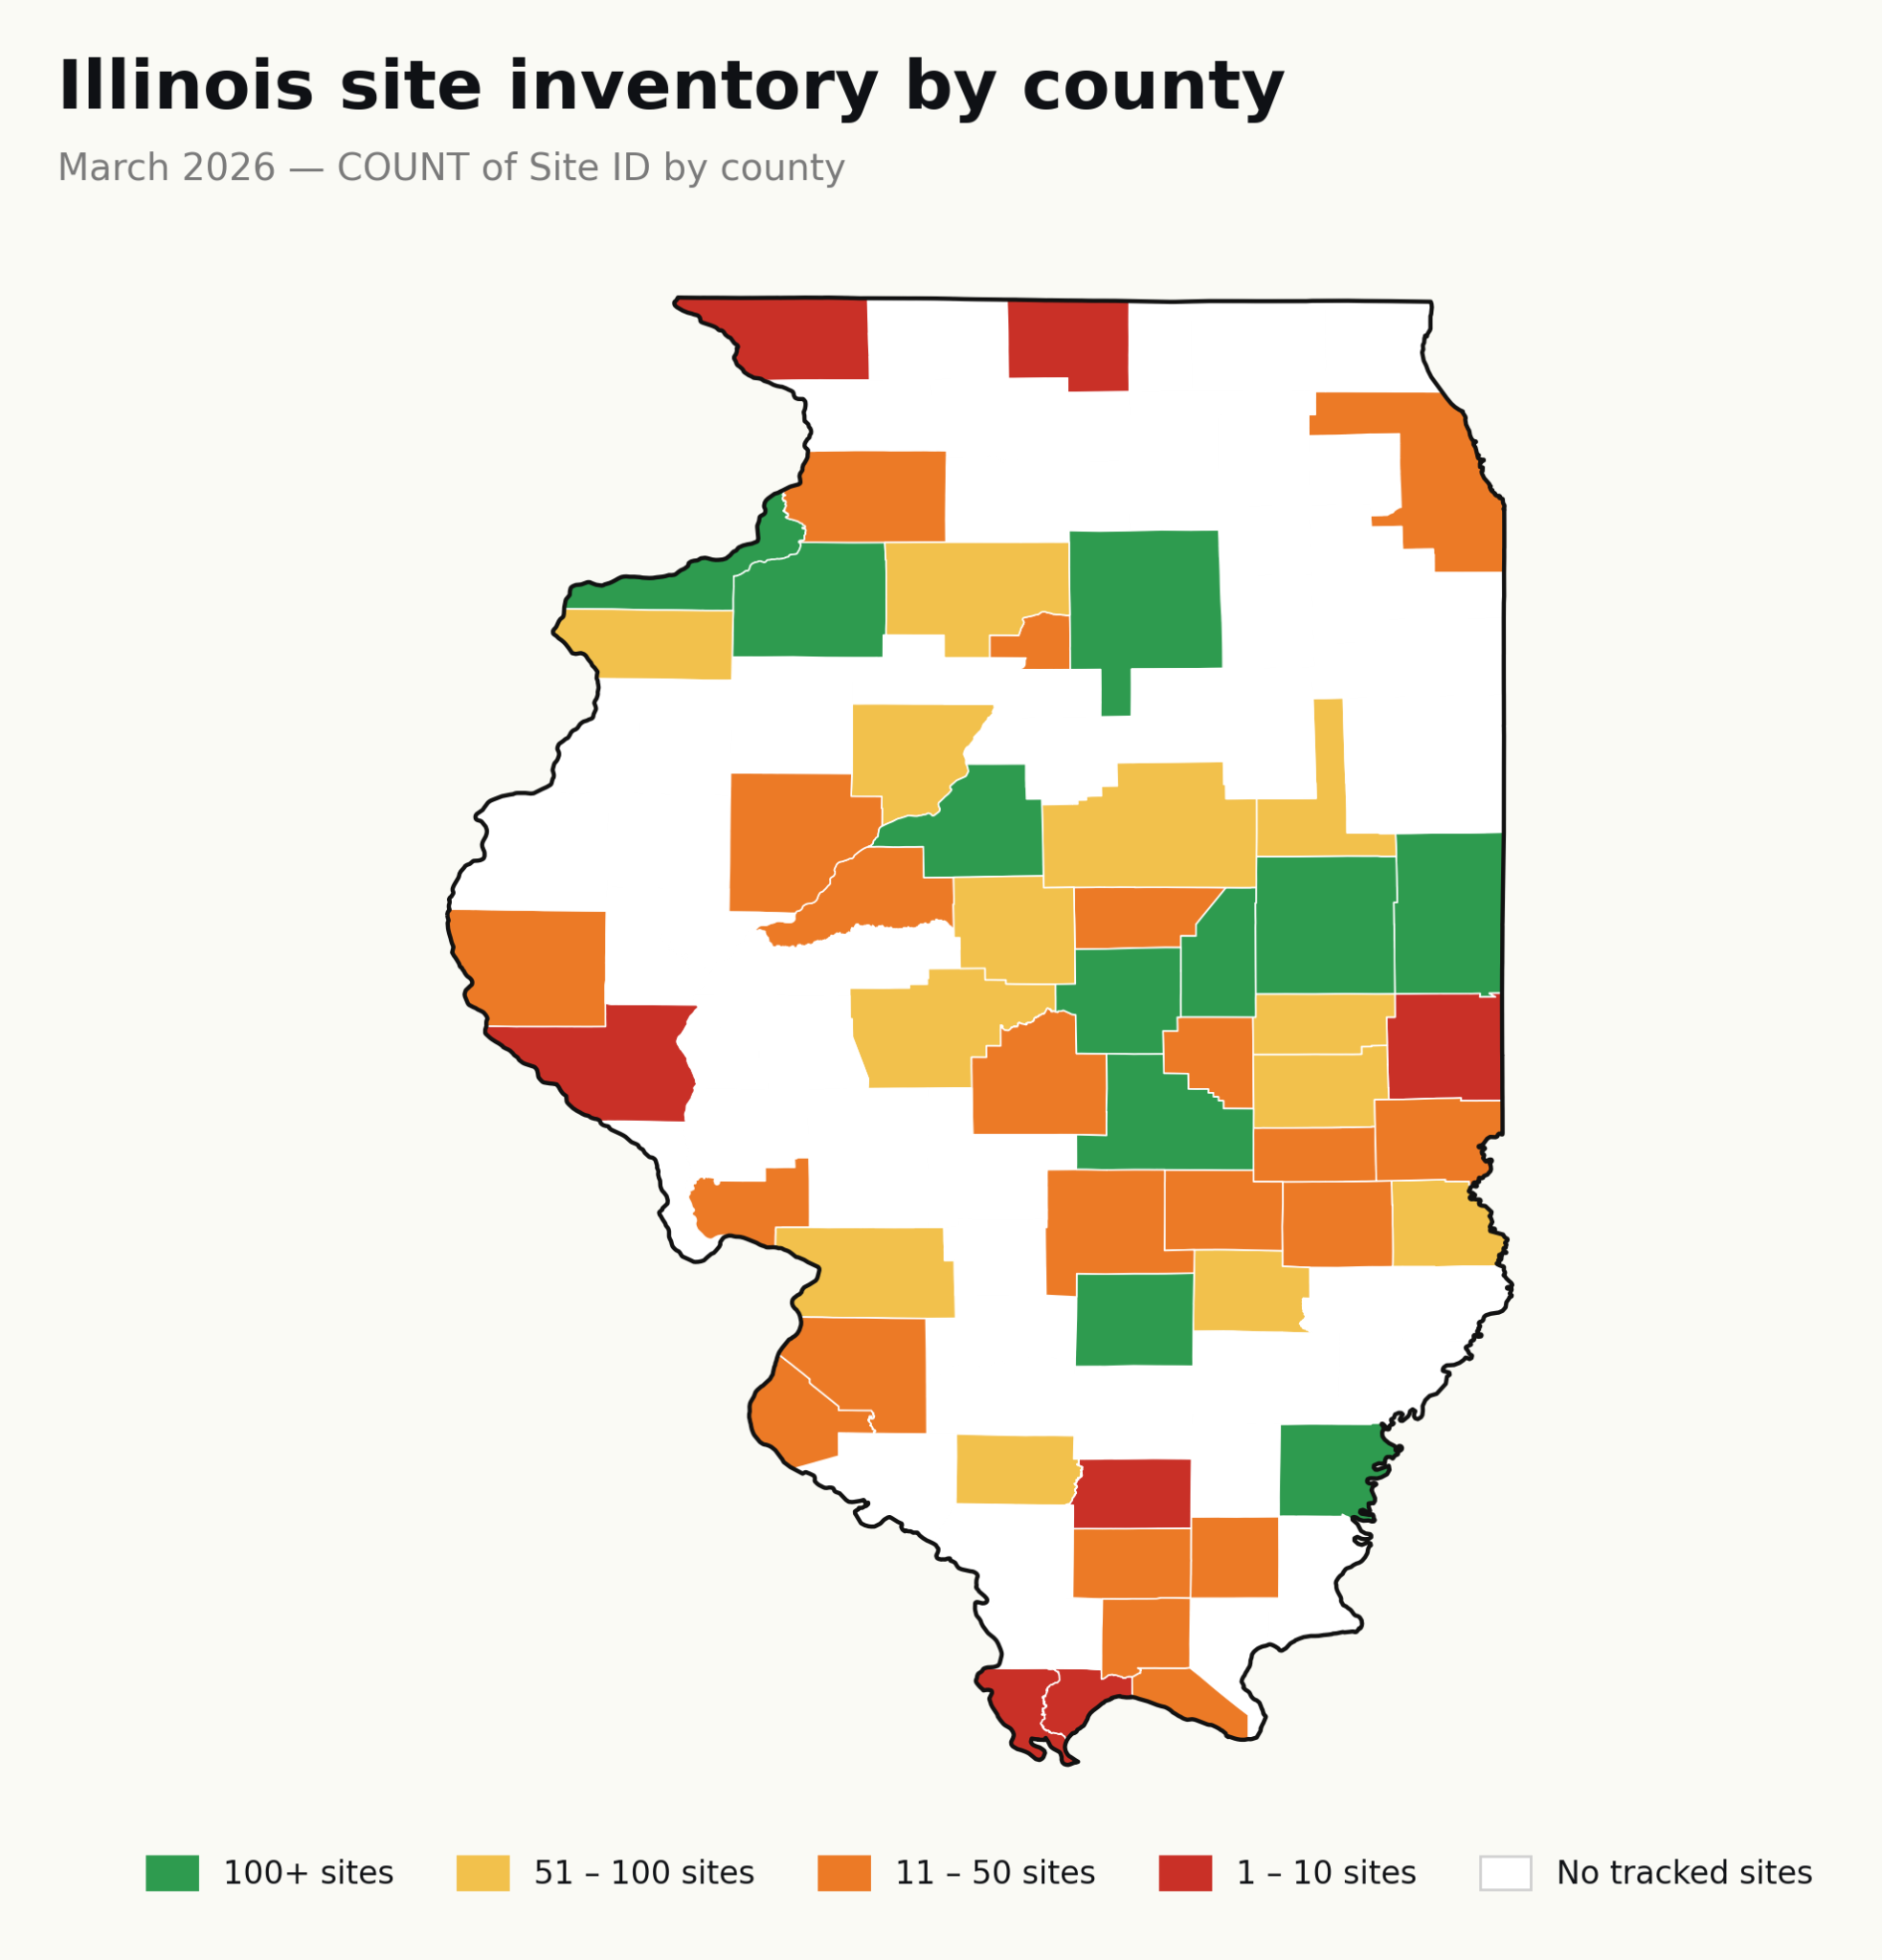
Illinois
Illinois enters March as one of the most stable markets in the MISO footprint, with modest inventory contraction and a premium rate that held largely intact. The structural dynamic that defined February persists: the highest-scoring counties and highest-volume counties remain largely distinct populations. Developers continue to benefit from running both filters in parallel, pairing premium-quality targets with high-volume pipelines rather than optimizing for either metric alone. The only meaningful shift is the entry of Peoria County into the top-5 by score, reflecting a slight tightening at the quality threshold.
Site quality breakdown


February to March: What changed
- Total sites declined modestly from 3,595 to 3,541 (-1.5%), and premium inventory contracted from 485 to 468 sites (-3.5%). The premium rate slipped from 13.5% to 13.2%, the smallest month-over-month move of any returning MISO state.
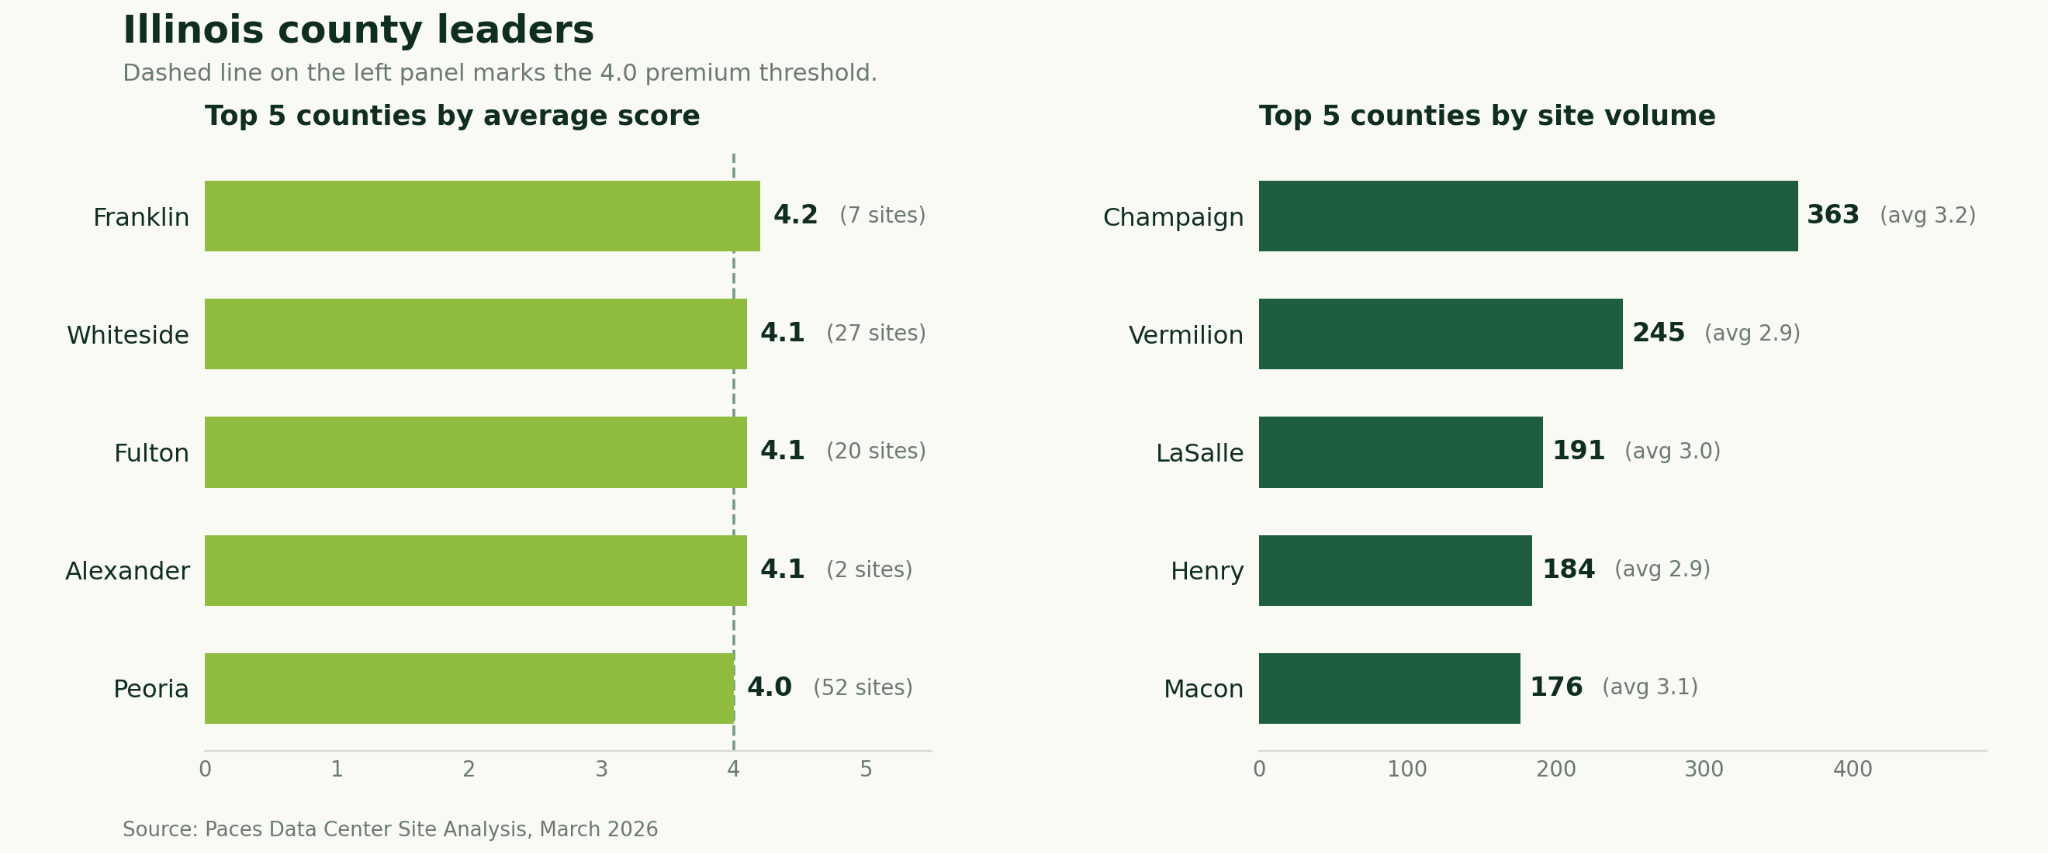
- The quality-leader roster is nearly unchanged: Franklin, Whiteside, Fulton, and Alexander held their positions. Peoria County (4.0 avg, 52 sites) entered the top 5 by score, displacing Cumberland, whose average score dipped just below the threshold.
- Volume leadership is identical in county composition, with each county losing a handful of sites. Champaign remains the inventory workhorse at 363 sites. The quality-volume split structure that characterizes Illinois has not changed.
Key takeaways for Illinois
- Illinois contains 3,541 tracked sites across MISO. 13.2% of sites (468) score 4.0 or above (Premium threshold).
- Franklin County leads in average site score (4.2) with 7 sites.
- Champaign County leads in total site volume (363 sites, avg score 3.2).
- Peoria County (4.0 avg, 52 sites) is the strongest new entrant to the quality tier, offering meaningful volume at exactly the premium threshold.
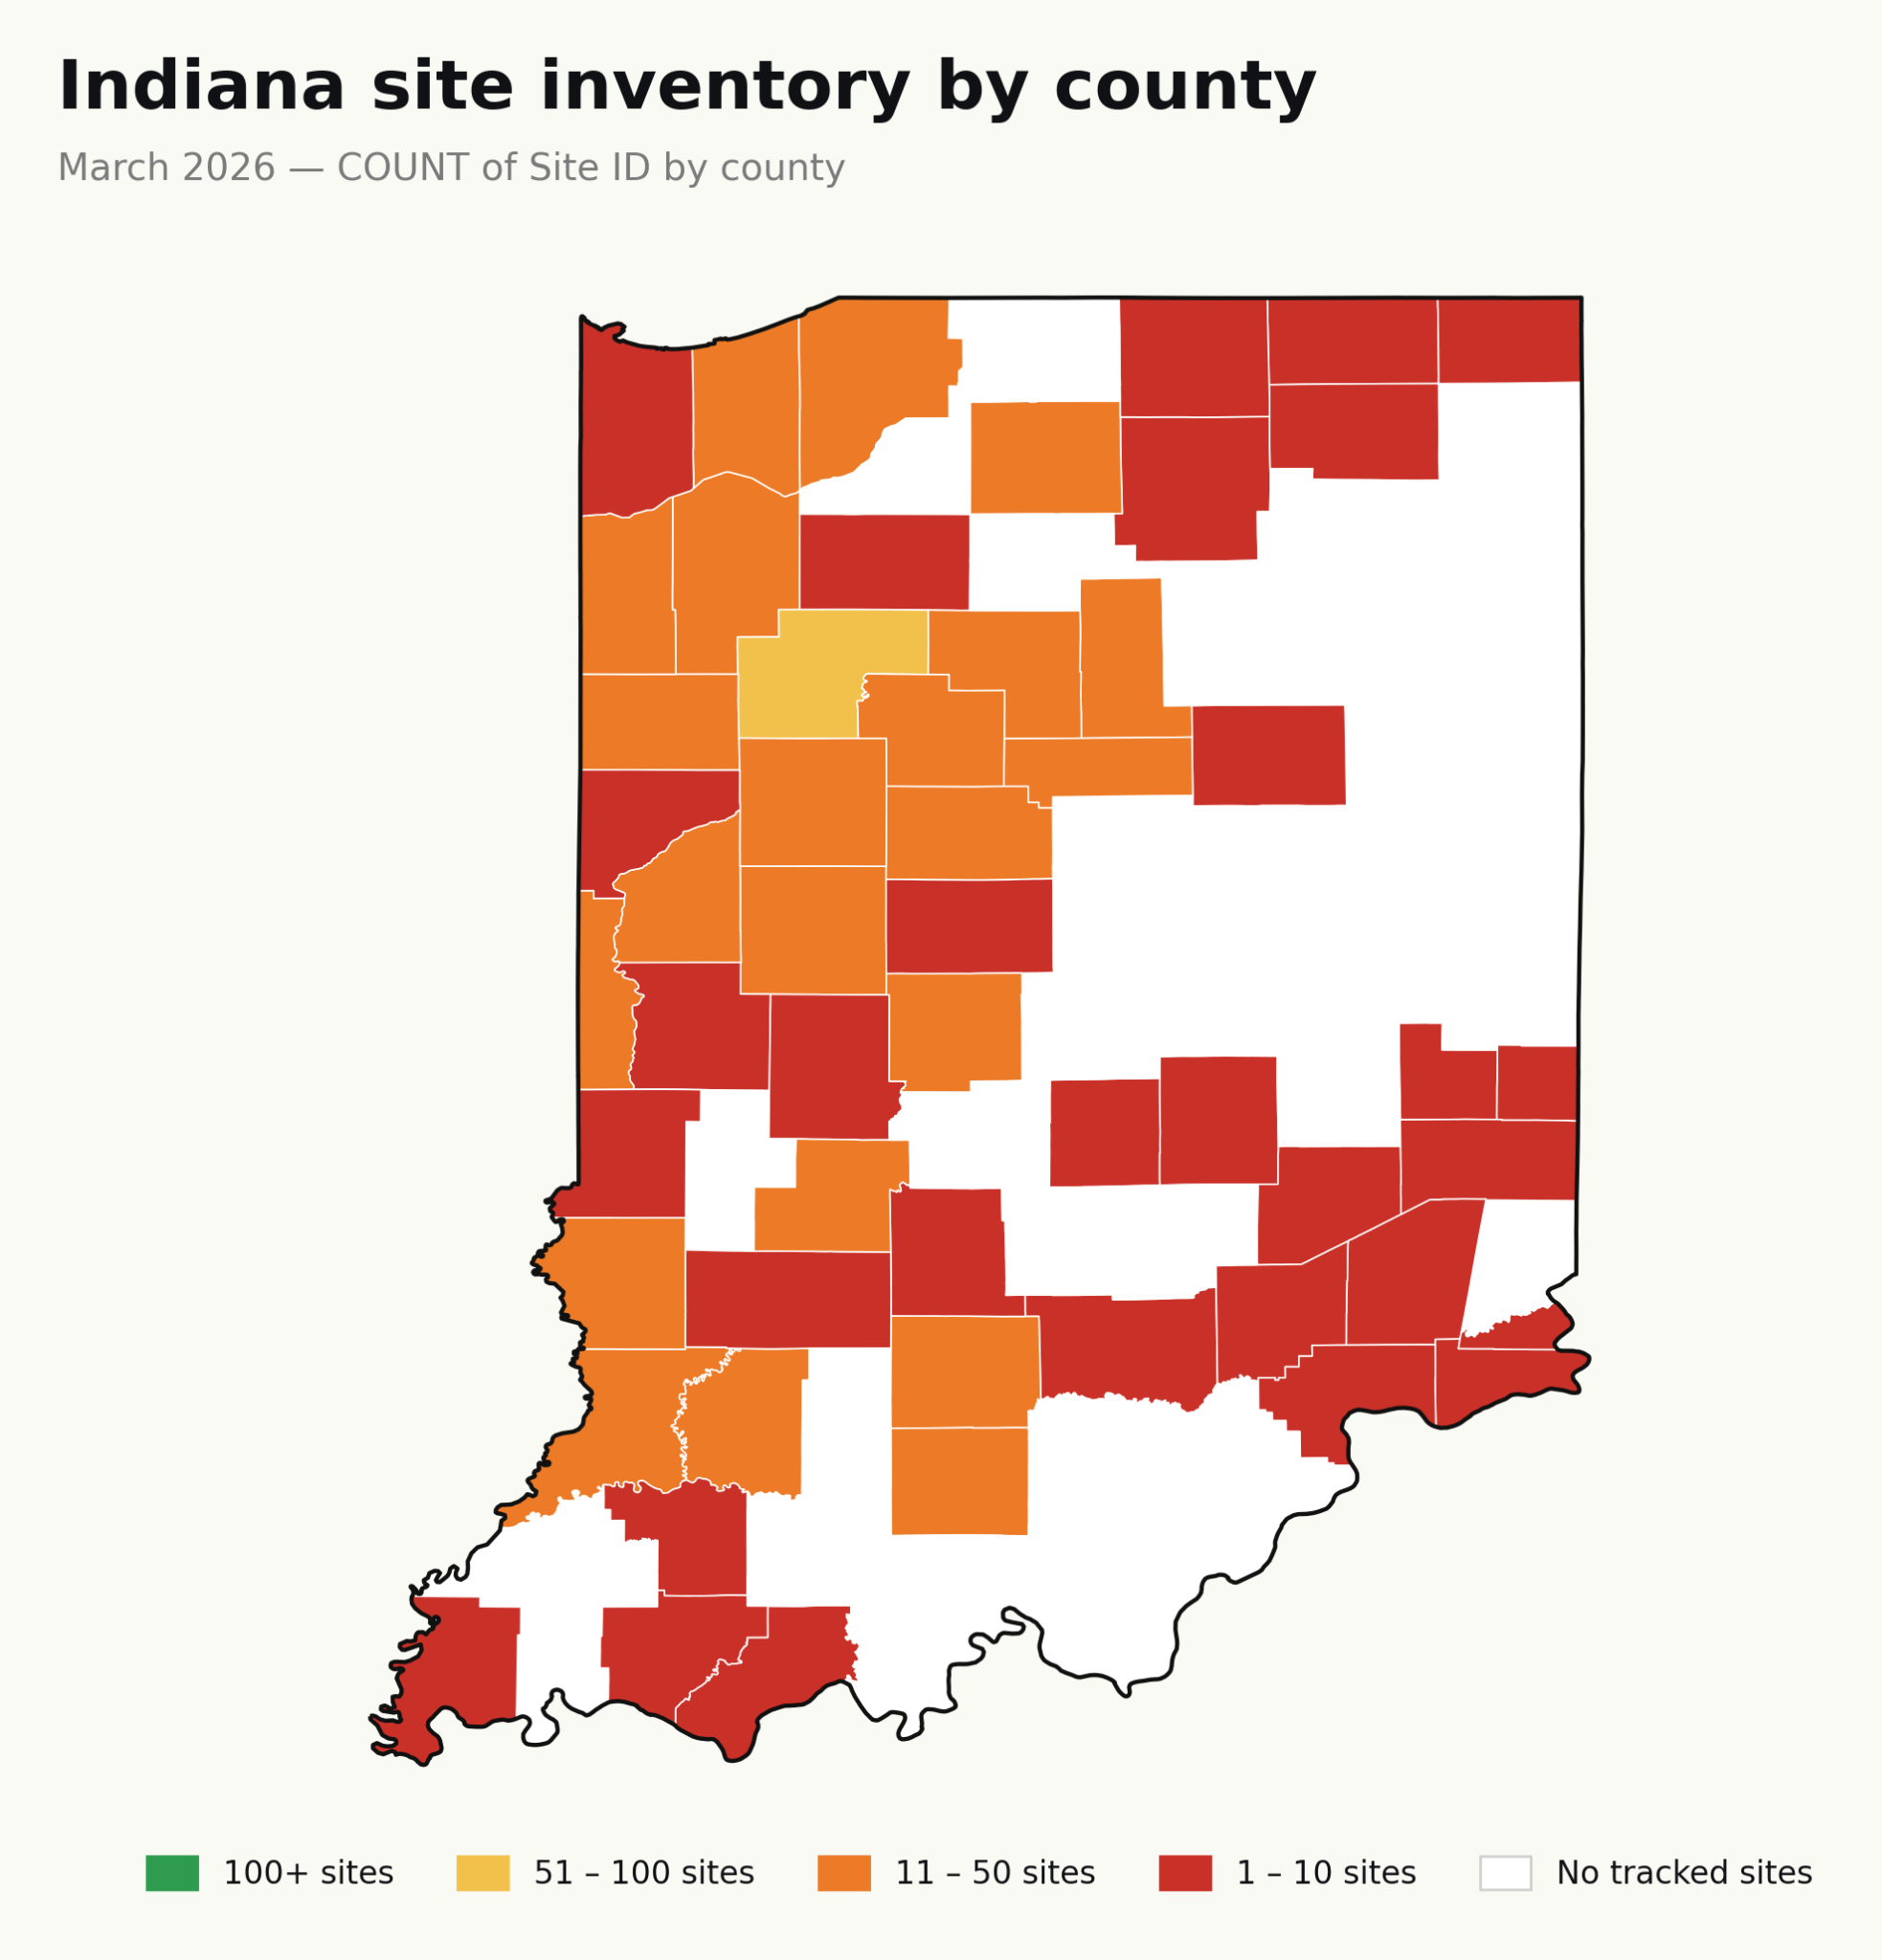
Indiana
Indiana's March dataset is a study in stability. Following the sharp contraction in February — when updated MISO data reduced total inventory by nearly 20% — the state's site universe held flat for a second consecutive cycle. That stabilization is a signal: the February recalibration reflected a data update rather than an ongoing drawdown, and the resulting inventory appears durable. The state's quality profile remains one of the strongest in the MISO footprint, and its pipeline structure has not changed materially.

February to March: What changed
- Total sites held at 724 for the second consecutive month. Premium inventory increased by one site, from 113 to 114, and the premium rate ticked up from 15.6% to 15.7%. The average score was unchanged at 3.35.
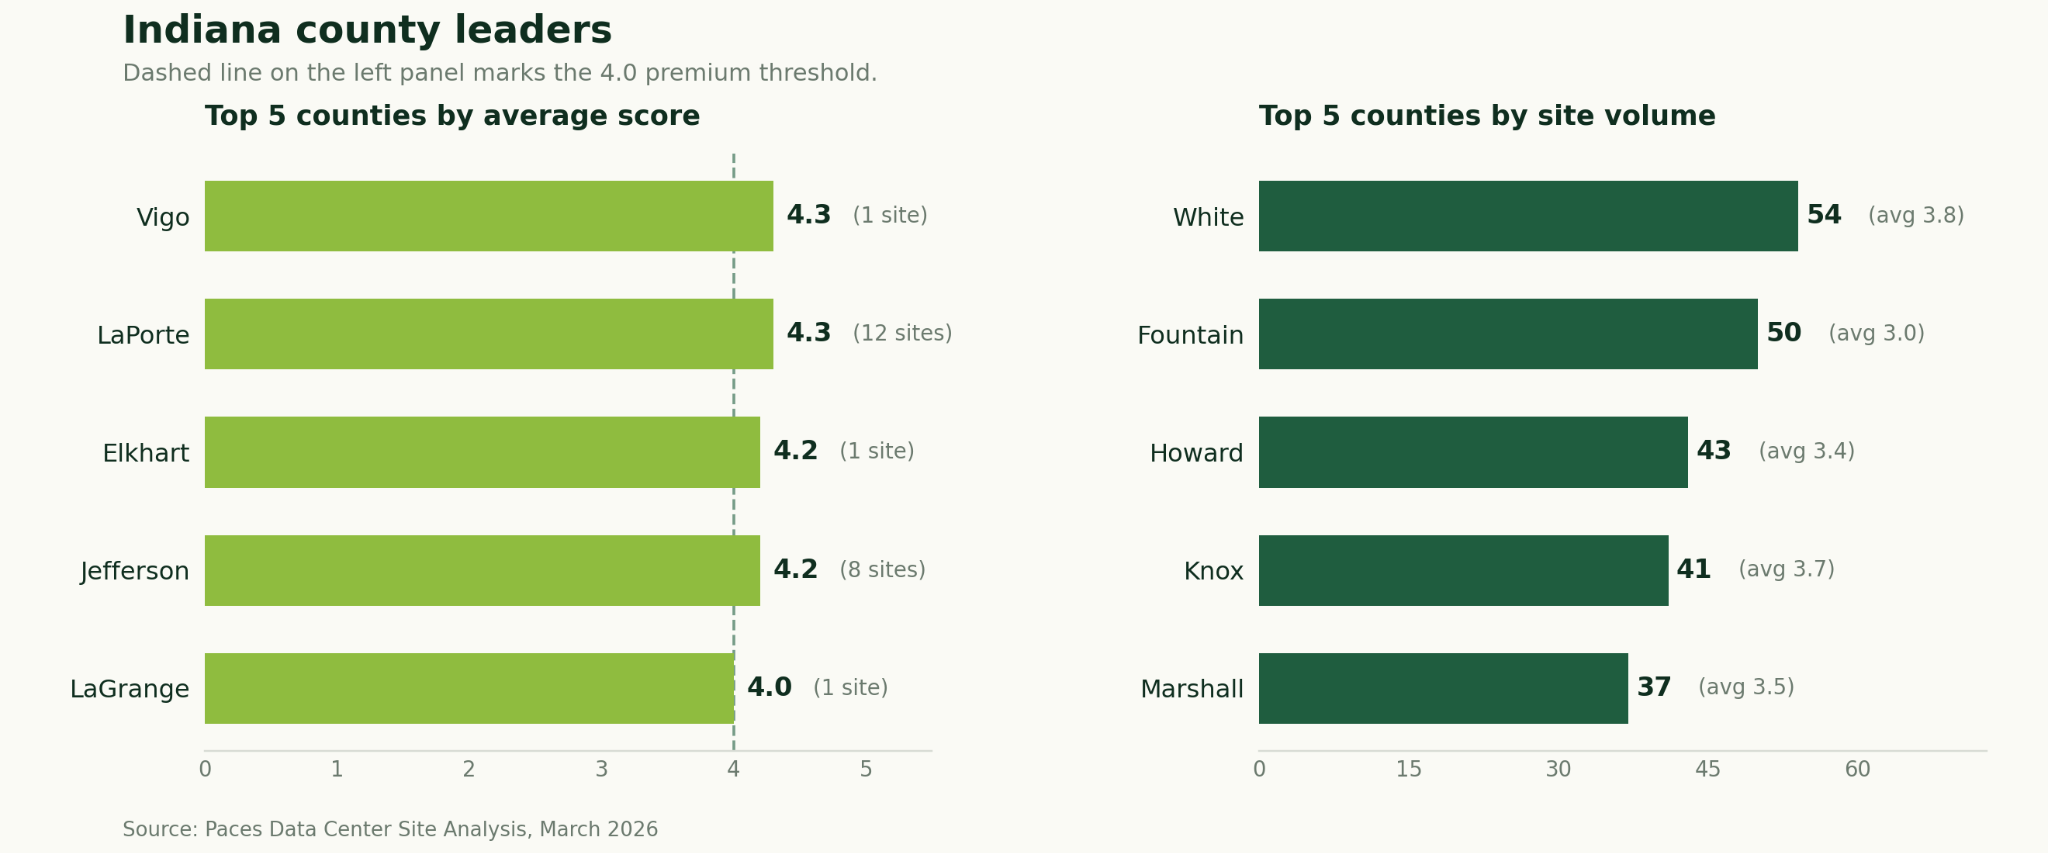
- The quality-leader composition is identical across both months. Vigo, LaPorte, Elkhart, Jefferson, and LaGrange all retained their positions, with only minor score adjustments at the second decimal.
- Volume leadership is also identical: White County leads at 54 sites (avg 3.83), followed by Fountain, Howard, Knox, and Marshall with no changes in county rankings or site counts.
Key takeaways for Indiana
- Indiana contains 724 tracked sites across MISO. 15.7% of sites (114) score 4.0 or above (Premium threshold).
- Vigo County leads in average site score (4.35) with 1 site.
- White County leads in total site volume (54 sites, avg score 3.83), the highest volume-leader average score of any state in this report.
- Indiana's site inventory has now held flat for two consecutive months, suggesting the February recalibration was a one-time data reset rather than the start of a prolonged contraction.
Iowa
Iowa enters the report as the second-largest MISO market tracked, with 5,269 sites across a geographically wide footprint. At 11.7%, the state's premium rate is below the ten-state average, but the raw premium count of 615 sites is substantial. The most notable structural feature is the quality-volume split: the highest-scoring counties — Louisa, Pottawattamie, and Henry — are concentrated in the southern and western portions of the state, while the largest-volume counties cluster in the central corridor. Henry County offers the clearest dual-signal opportunity, with an average score of 4.02 and 90 sites. Iowa's MISO connection means developers can evaluate it alongside Illinois, Indiana, and Missouri as part of an integrated grid-access strategy.
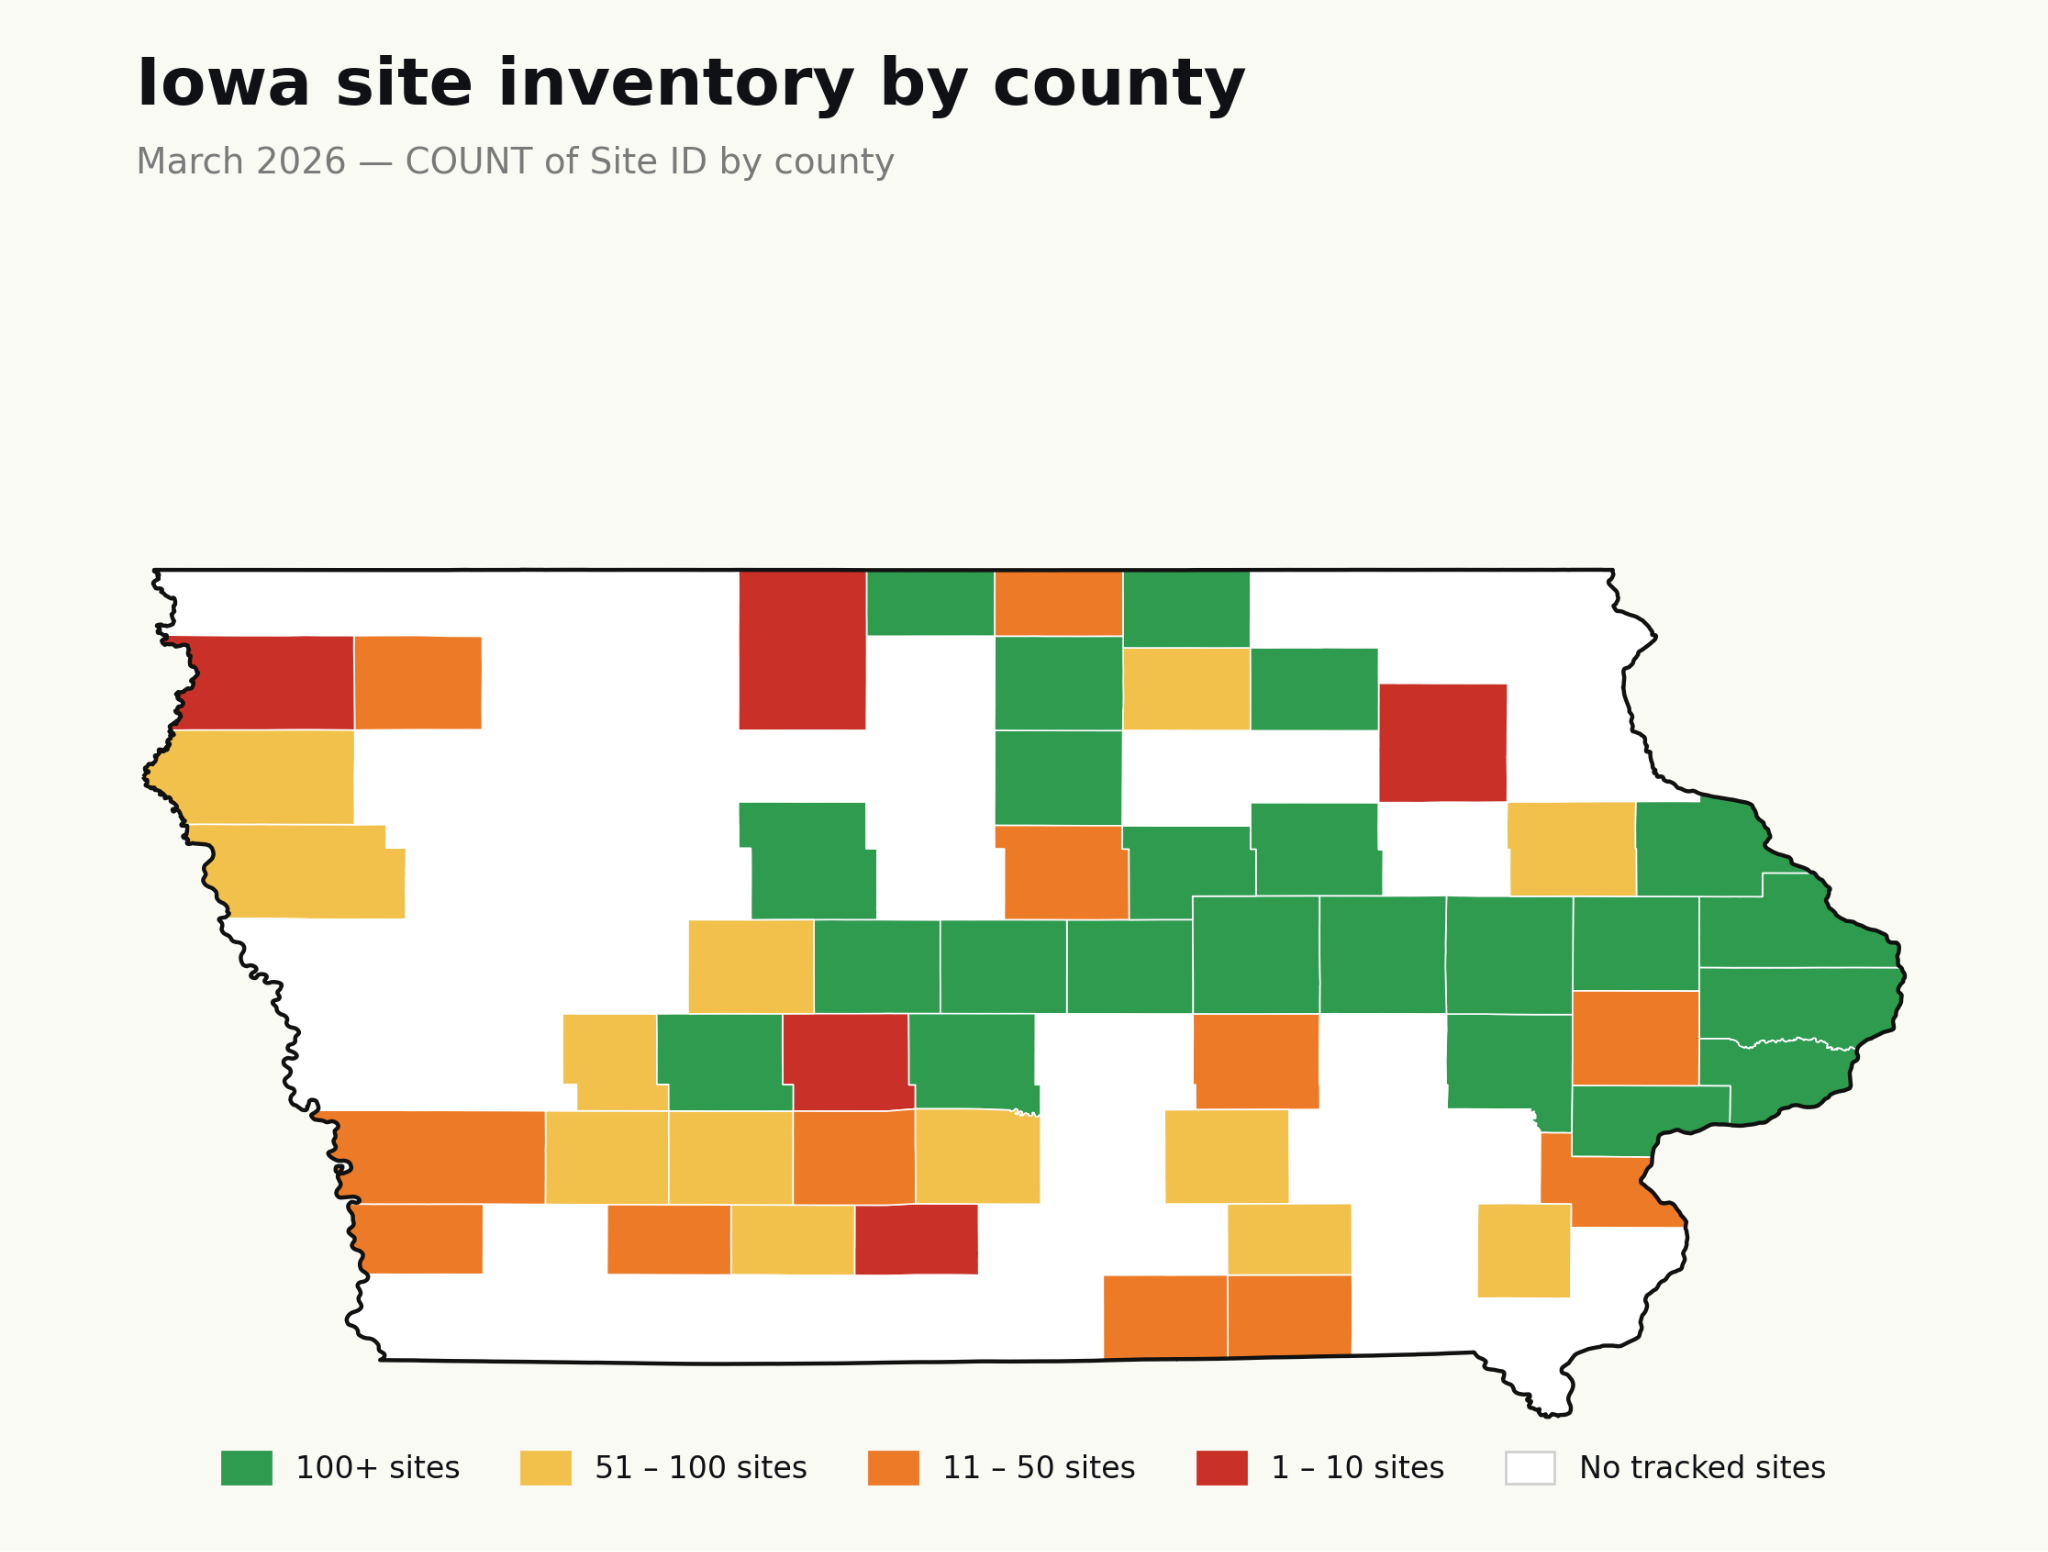

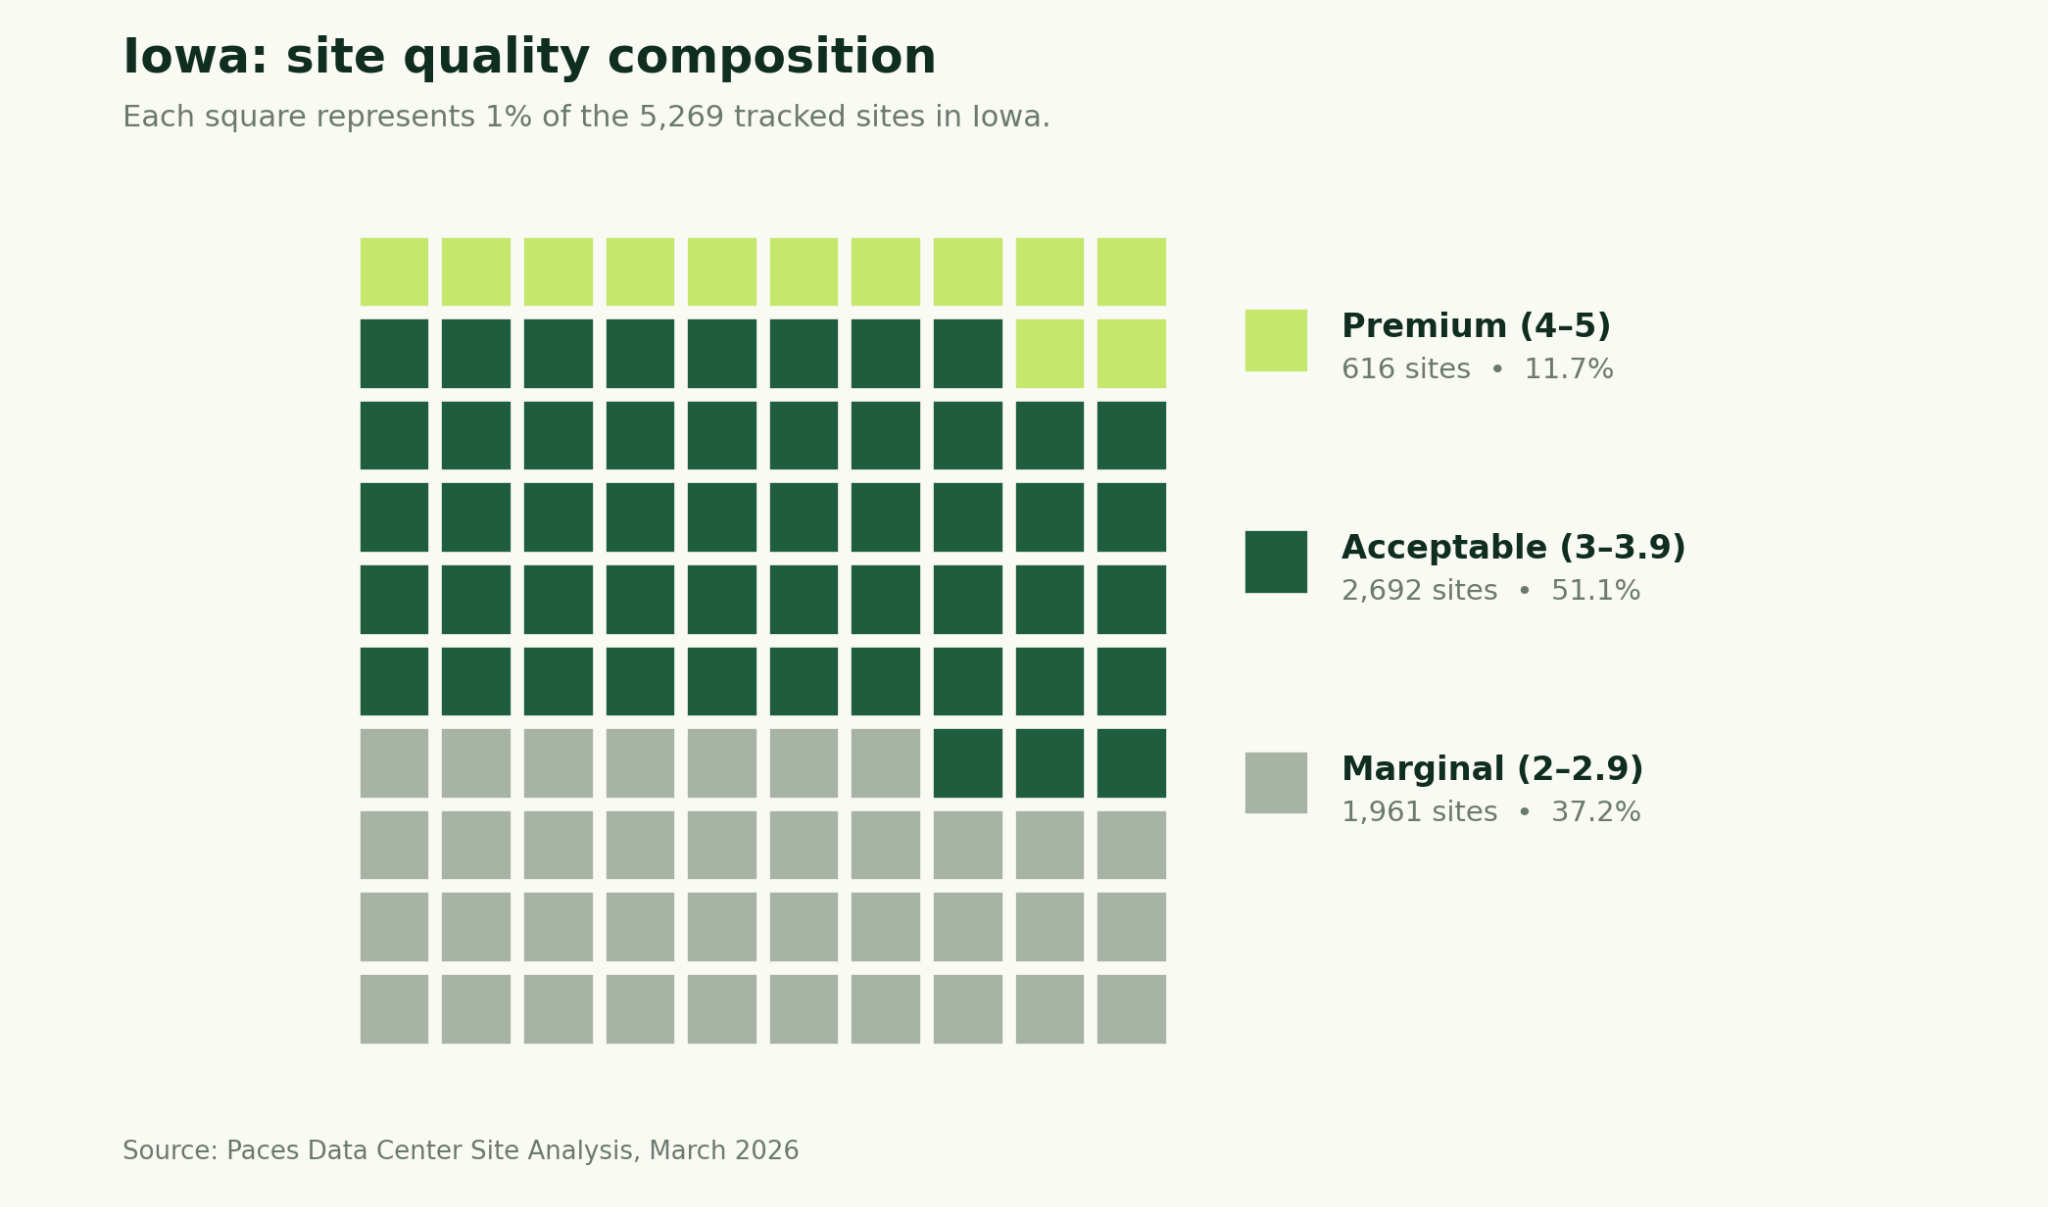
Key takeaways for Iowa
- Iowa contains 5,269 tracked sites across MISO, making it the second-largest market in this report by total inventory.
- Louisa County leads in average site score (4.17) with 12 sites.
- Scott County leads in total site volume (255 sites, avg score 3.19).
- Henry County (4.02 avg, 90 sites) offers the strongest combination of premium-tier quality and meaningful volume in the state.
Missouri
Missouri continues to be the most constrained market in the MISO footprint. For the second consecutive month, no county averages 4.0 or above, and the premium rate has held at 5.3% since February. The modest inventory decline (-19 sites) reflects routine data refreshes rather than any acceleration of attrition. The strategic profile is unchanged: Missouri rewards disciplined parcel-by-parcel screening across a thin pipeline, and developers who calibrated their approach in February can run it with minimal adjustment in March.

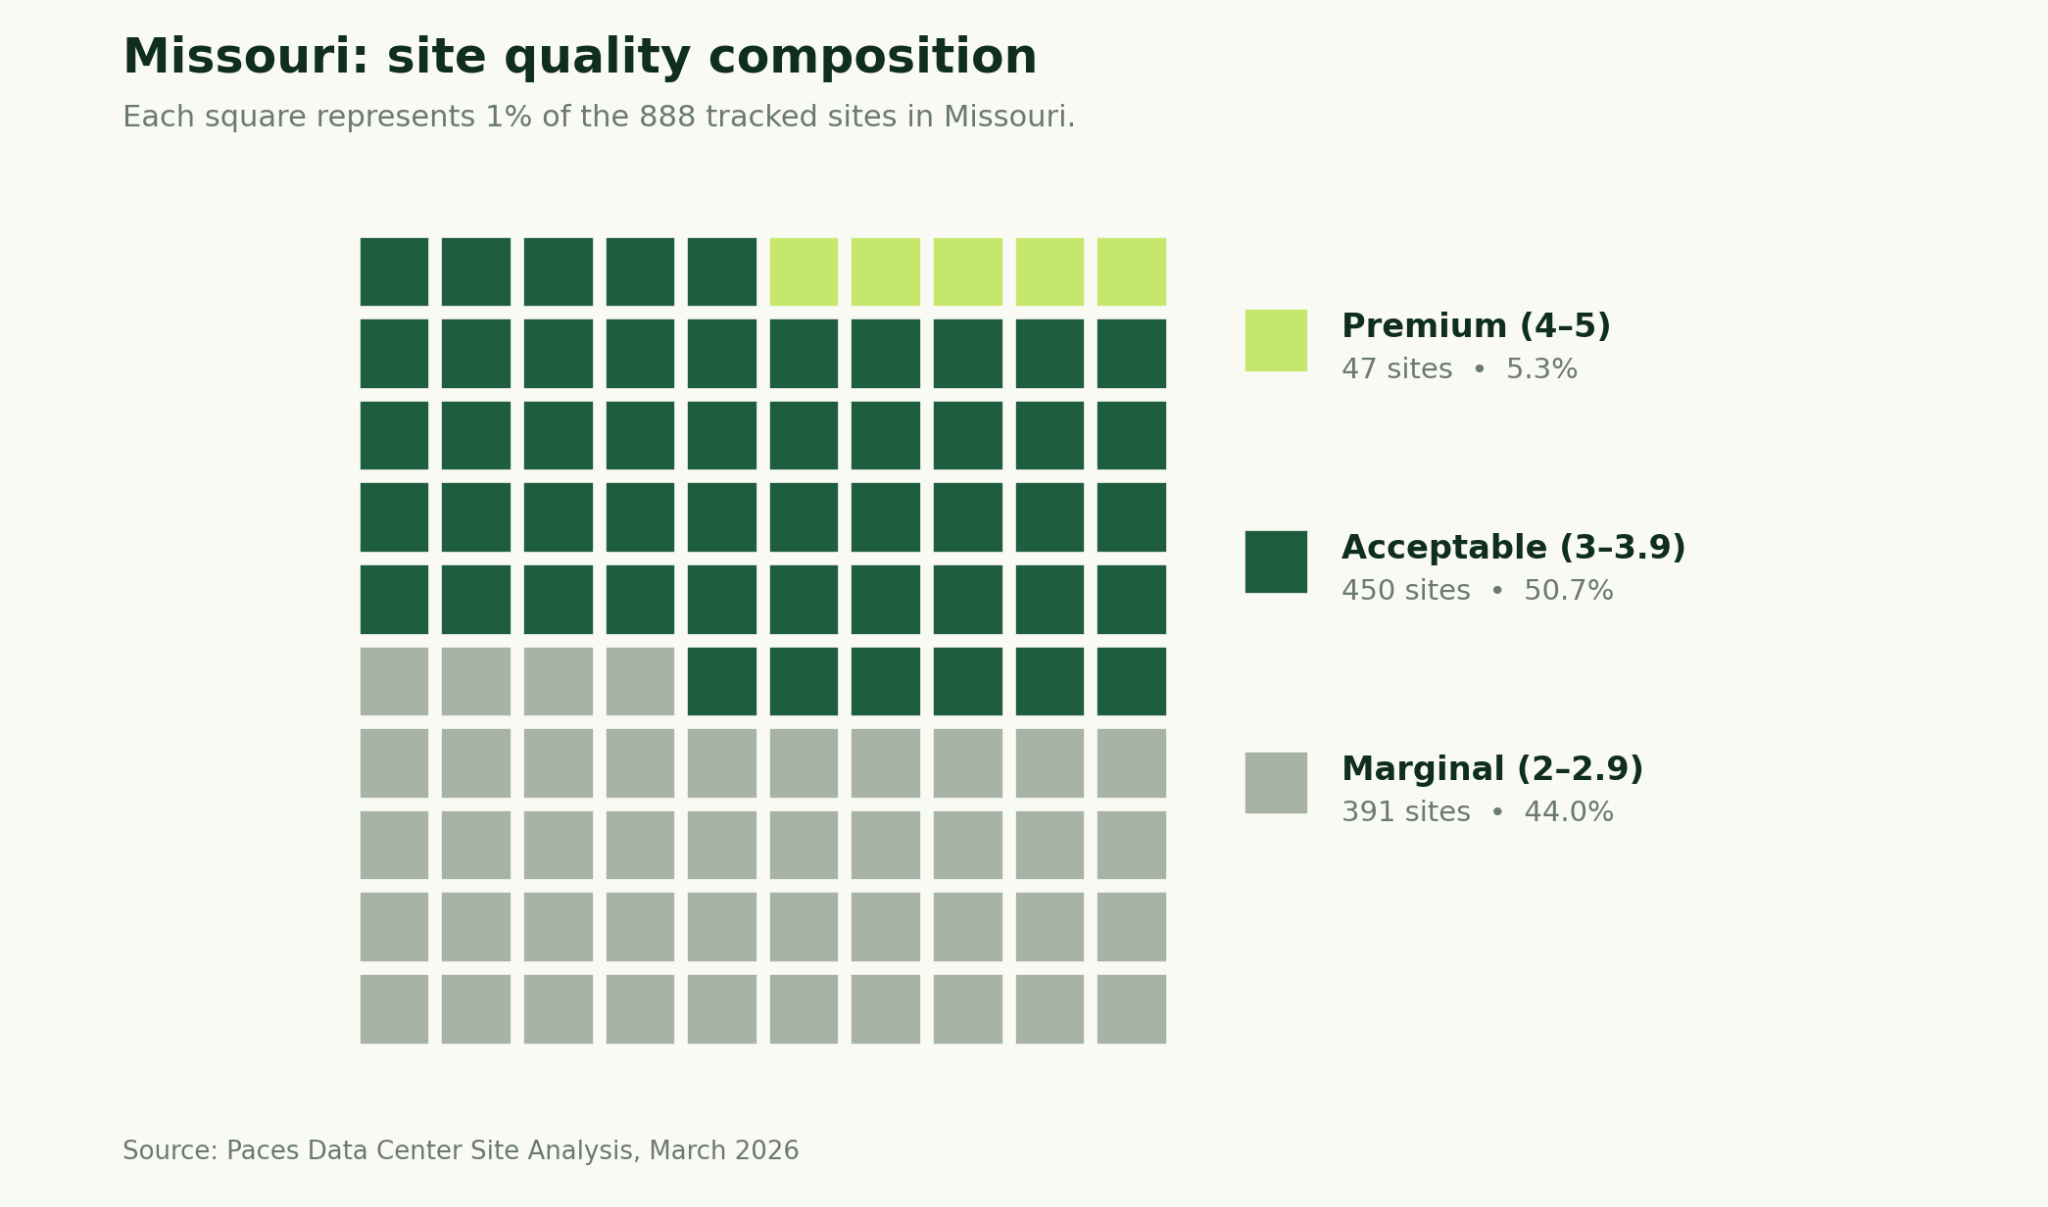

February to March: What changed
- Total sites declined from 907 to 888 (-2.1%), and premium inventory slipped from 48 to 47 sites. The premium rate held at 5.3% for the second consecutive month.
- St. Charles County's average score edged down from 3.6 to 3.5, dropping it below Callaway (also 3.5, but with more sites). Phelps County retained its top position at 3.9 average.
- Volume leadership is essentially unchanged: Audrain (163), Ralls (109), Pike (93), Scott (91), and Marion (63) are the same five counties in the same order, with minor site count adjustments.
Key takeaways for Missouri
- Missouri contains 888 tracked sites across MISO. 5.3% of sites (47) score 4.0 or above (Premium threshold), the lowest premium rate of any state in this report.
- Phelps County leads in average site score (3.9) with 39 sites. No county averages 4.0 or above.
- Audrain County leads in total site volume (163 sites, avg score 3.2).
- Missouri's premium parcels remain distributed individually across the state. Parcel-level screening, not county-level filtering, continues to be the required approach.
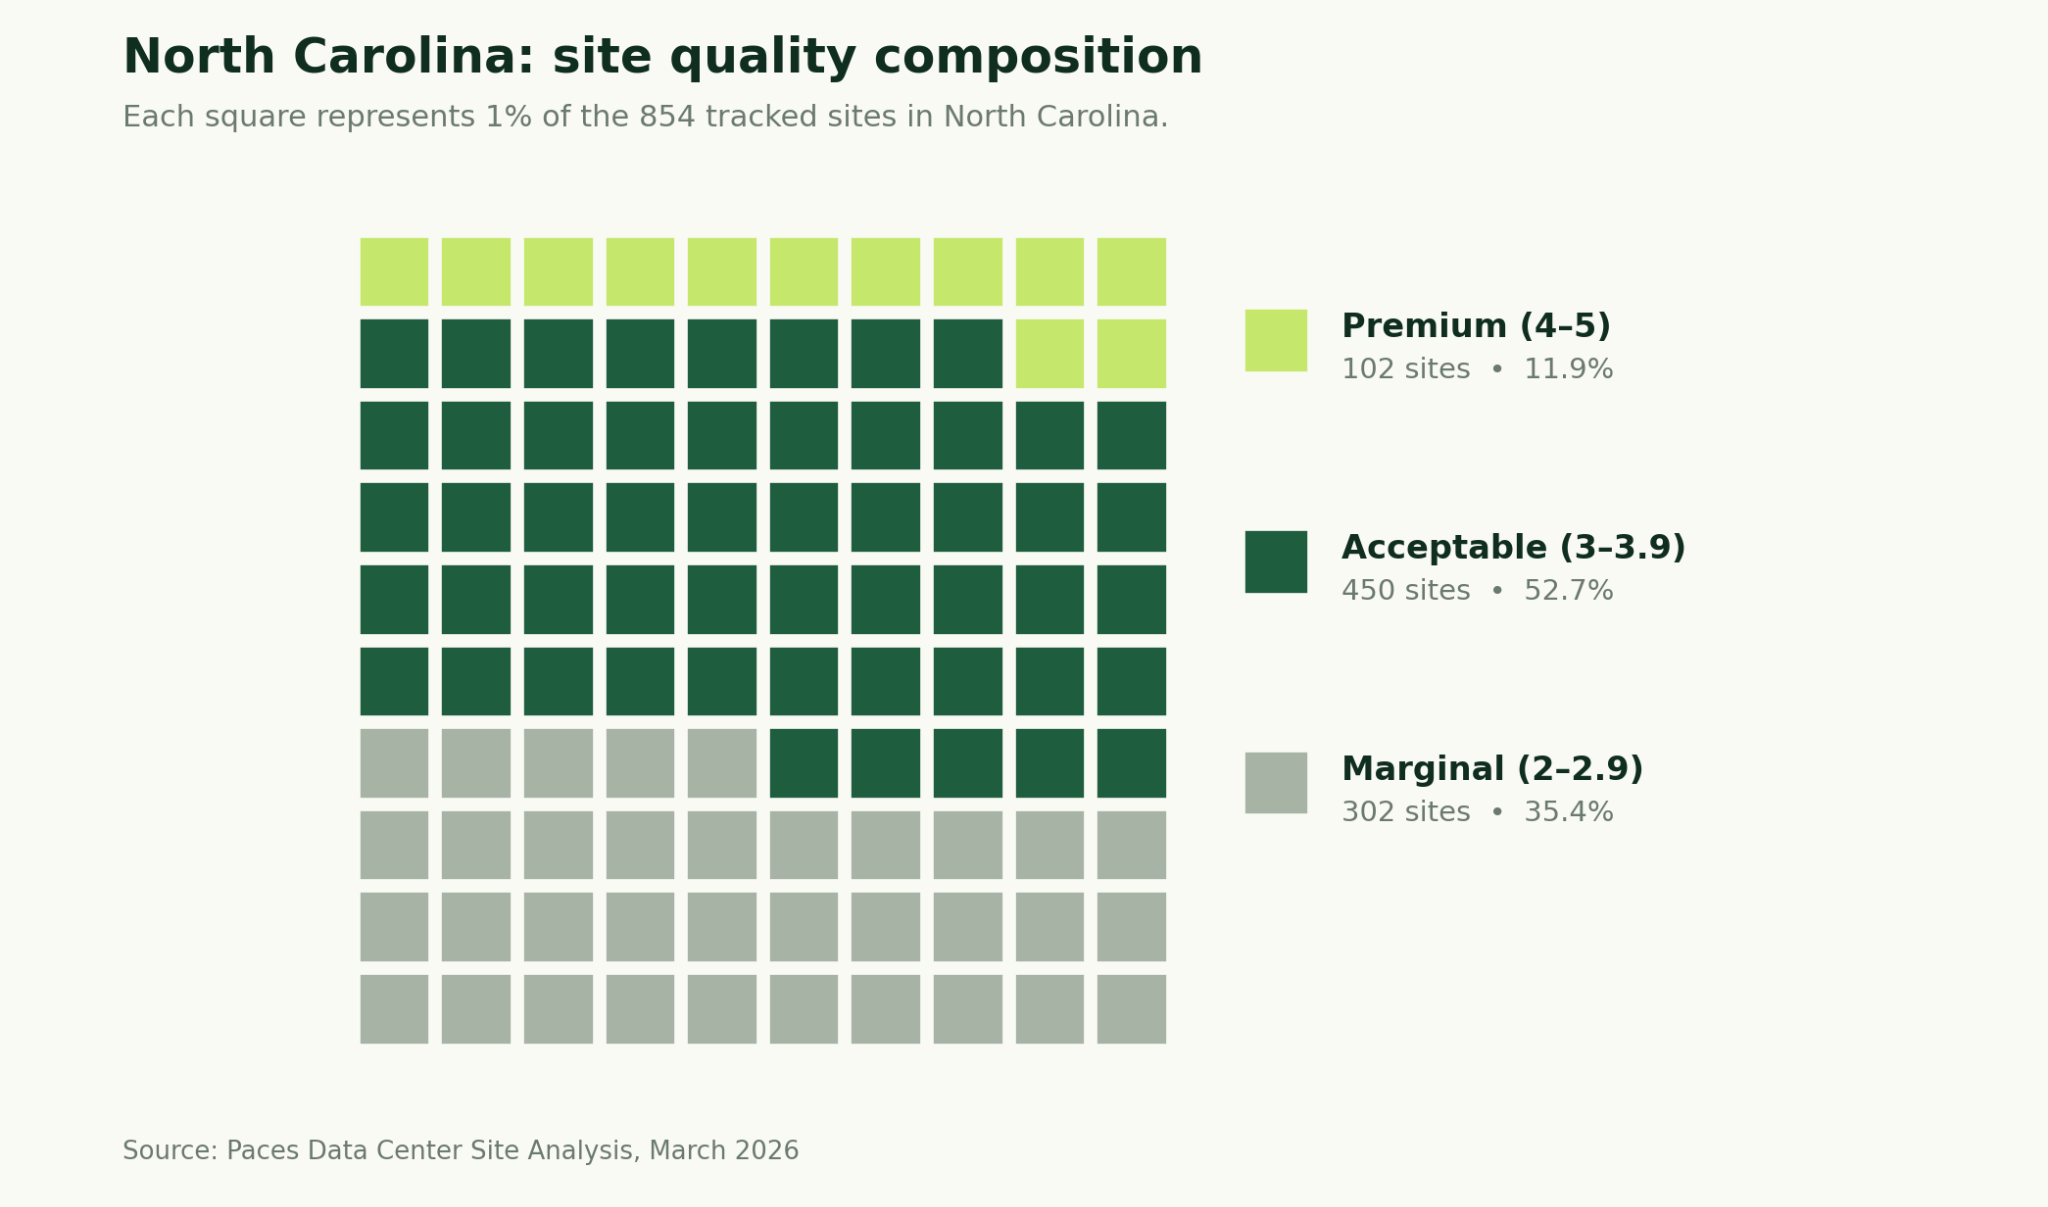
North Carolina
North Carolina enters the report as a relatively compact market, with 854 sites concentrated in the northeastern corridor of the state, a geography shaped by available transmission infrastructure in that region. No county averages 4.0 or above, with Perquimans County topping the quality ranking at 3.97. That near-premium ceiling, combined with the state's Duke Energy regulated utility structure, means developers need to account for a different interconnection process than the RTO-governed markets in this report. What North Carolina does offer is meaningful geographic proximity to Virginia's data center corridor, and Halifax and Bertie counties both appear in the top five for both quality and volume, which is a dual-signal pattern worth noting for developers already active in the southeastern PJM/Duke border region.
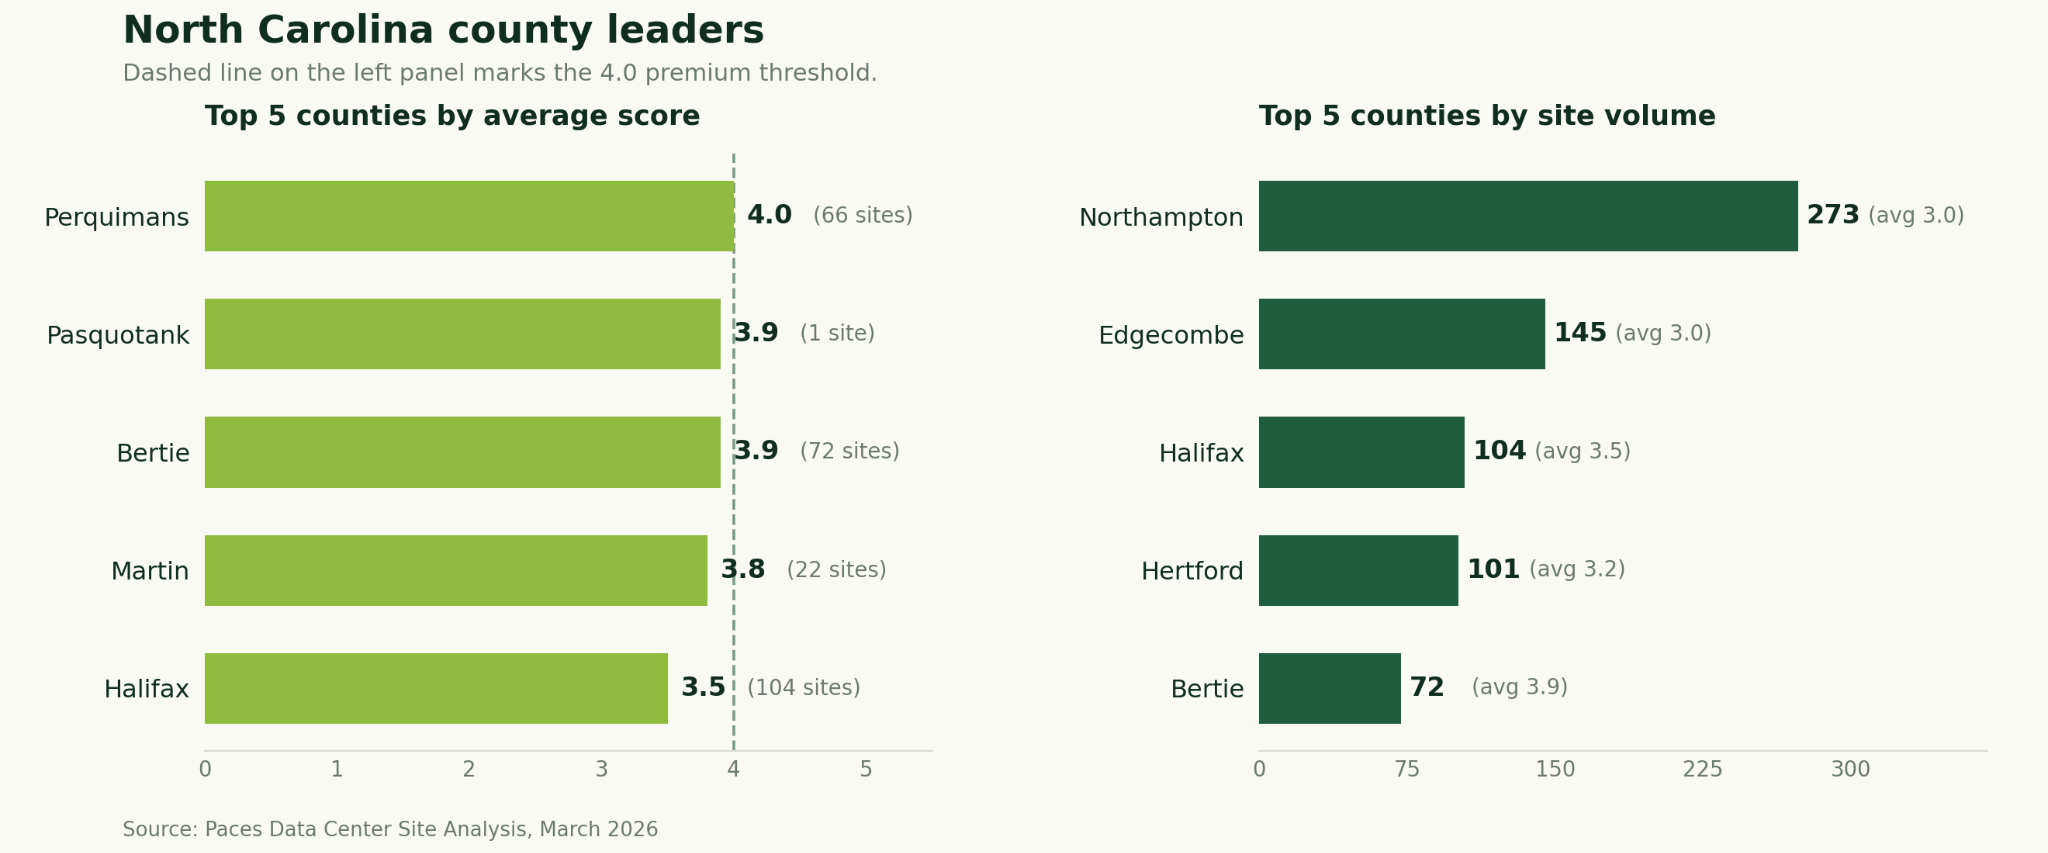
Key takeaways for North Carolina
- North Carolina contains 854 tracked sites. 11.9% of sites (102) score 4.0 or above (Premium threshold).
- Perquimans County leads in average site score (3.97) with 66 sites — the strongest combination of near-premium quality and meaningful volume in the state.
- Northampton County leads in total site volume (273 sites, avg score 3.0).
- Halifax County (3.45 avg, 104 sites) and Bertie County (3.85 avg, 72 sites) both appear in the top five for quality and volume, making them the most versatile screening targets in the state.
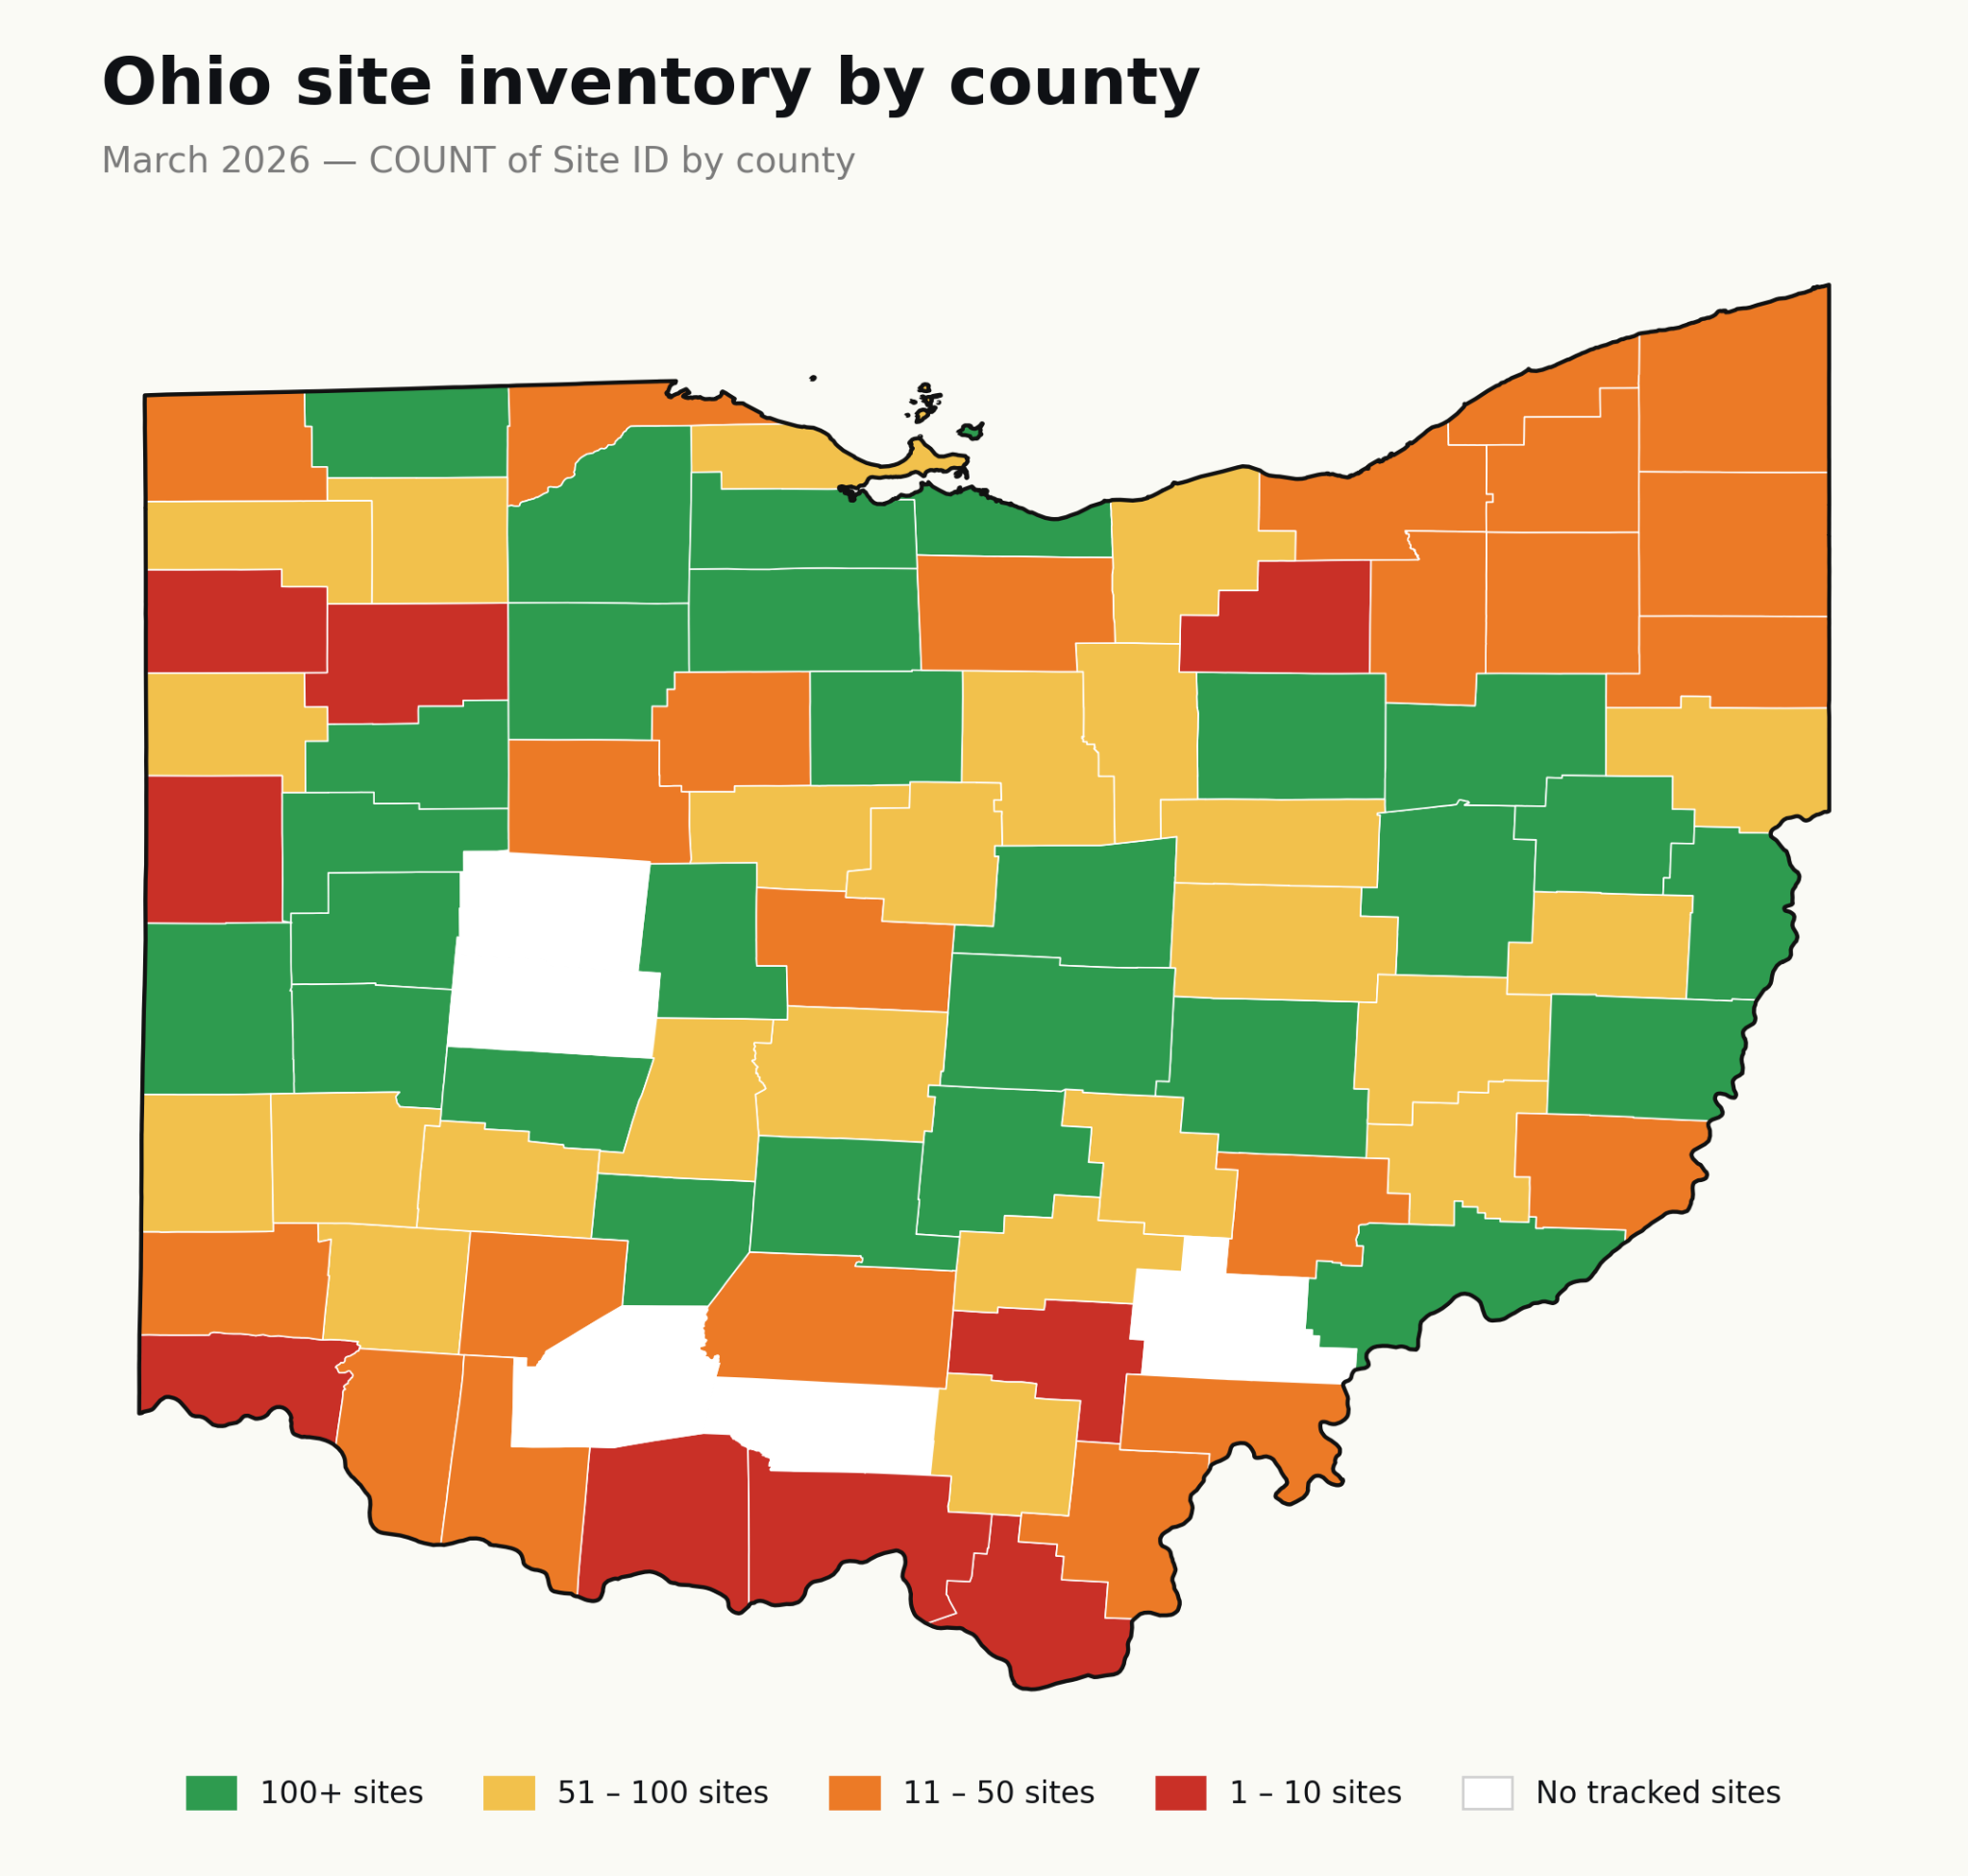
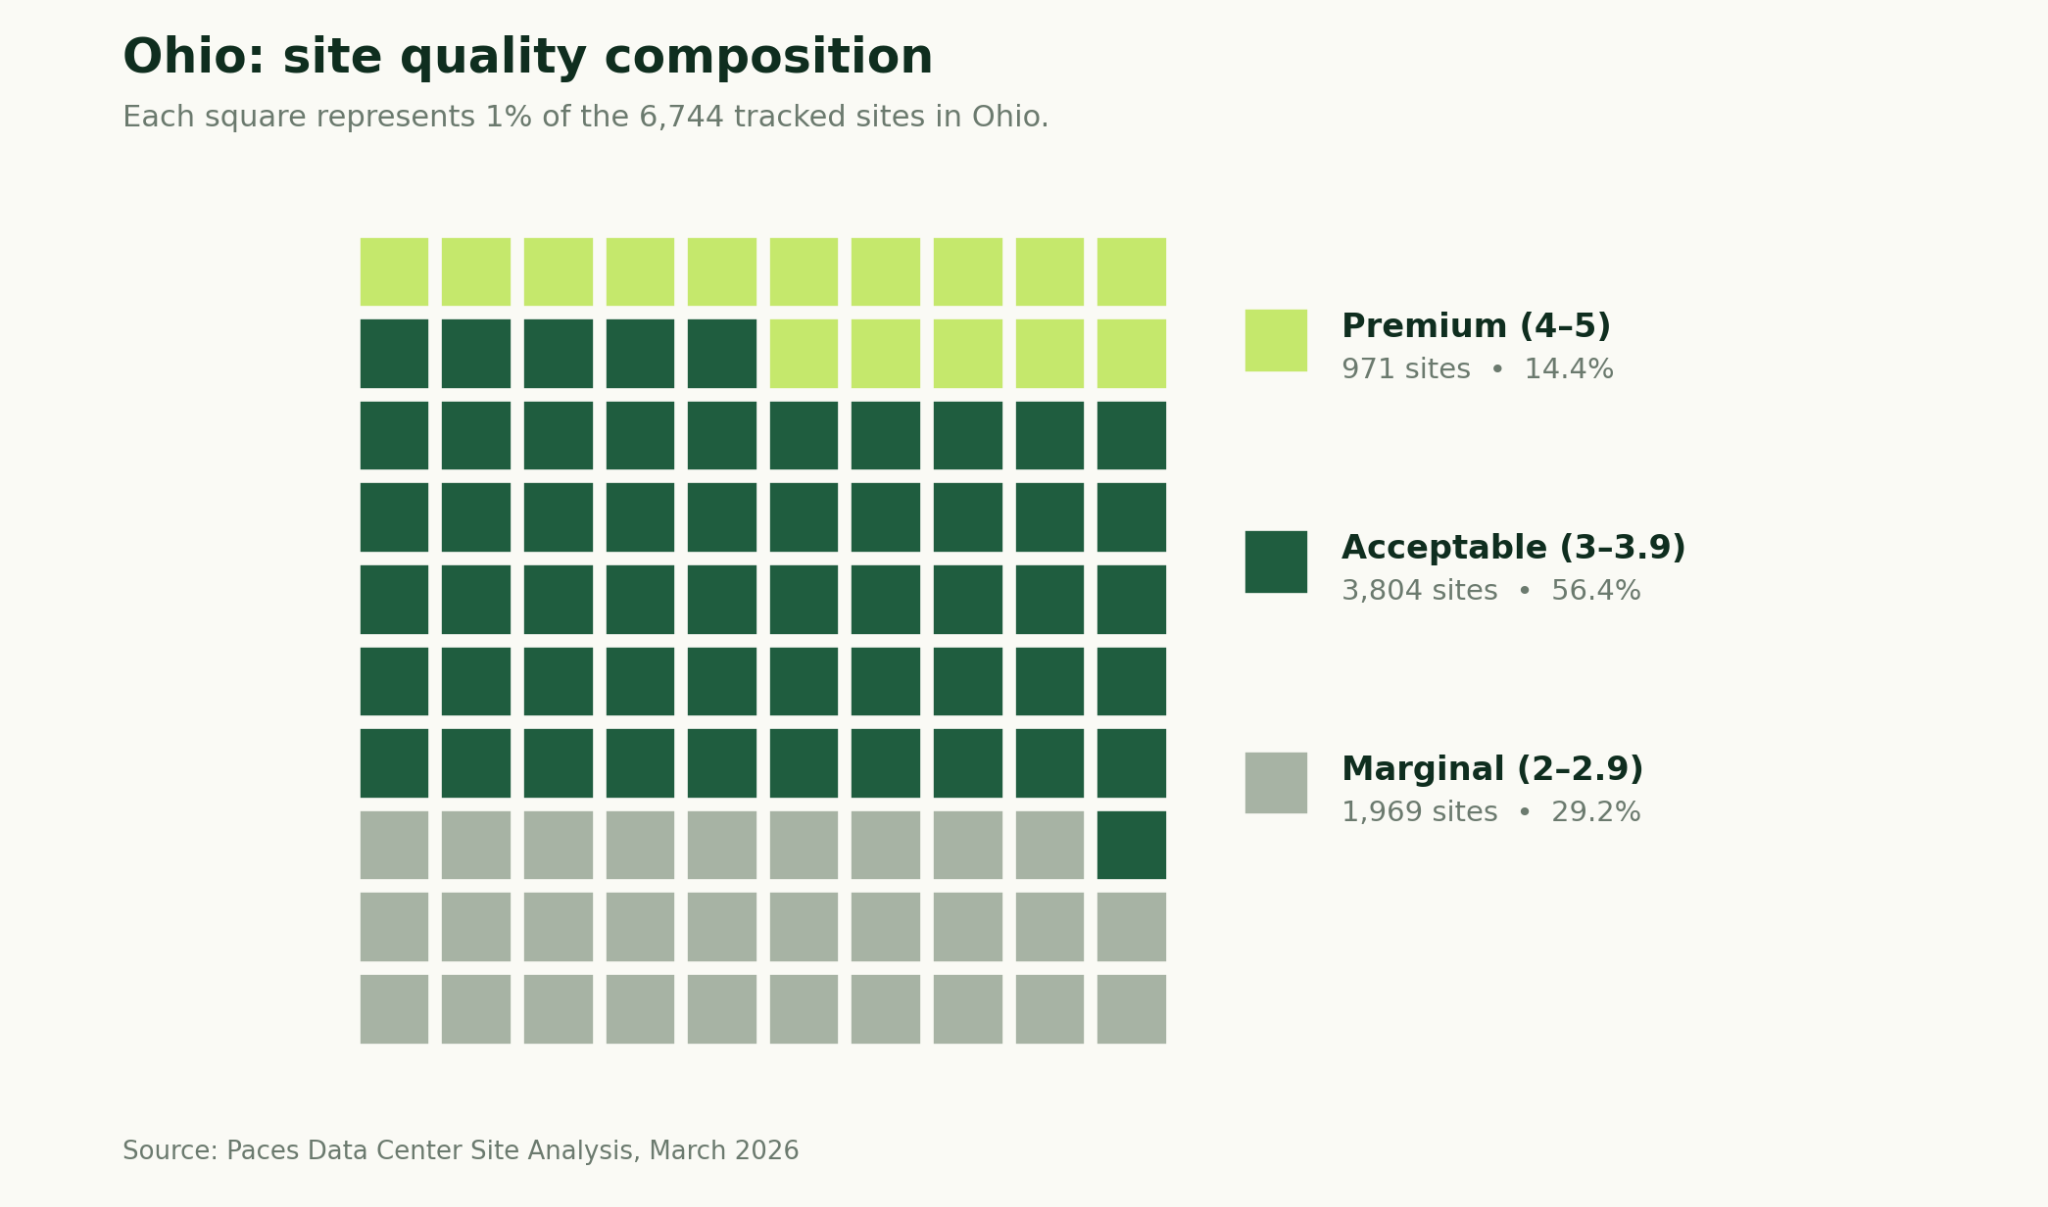
Ohio
Ohio remains the deepest market in this report by total site count, and March demonstrates the state's resilience: total inventory contracted modestly (-2.1%) while the premium rate ticked up slightly to 14.4%, as lower-quality sites exited the pool faster than premium ones. The most notable development is in the volume-leader tier: Seneca, Pickaway, and Fulton have emerged as the top counties by site count, each with 200+ sites. That shift reflects updated capacity data and parcel screening rather than new availability, but it means the high-volume targeting opportunities in Ohio are meaningfully different this cycle, and pipelines built on February's volume data should be re-screened.
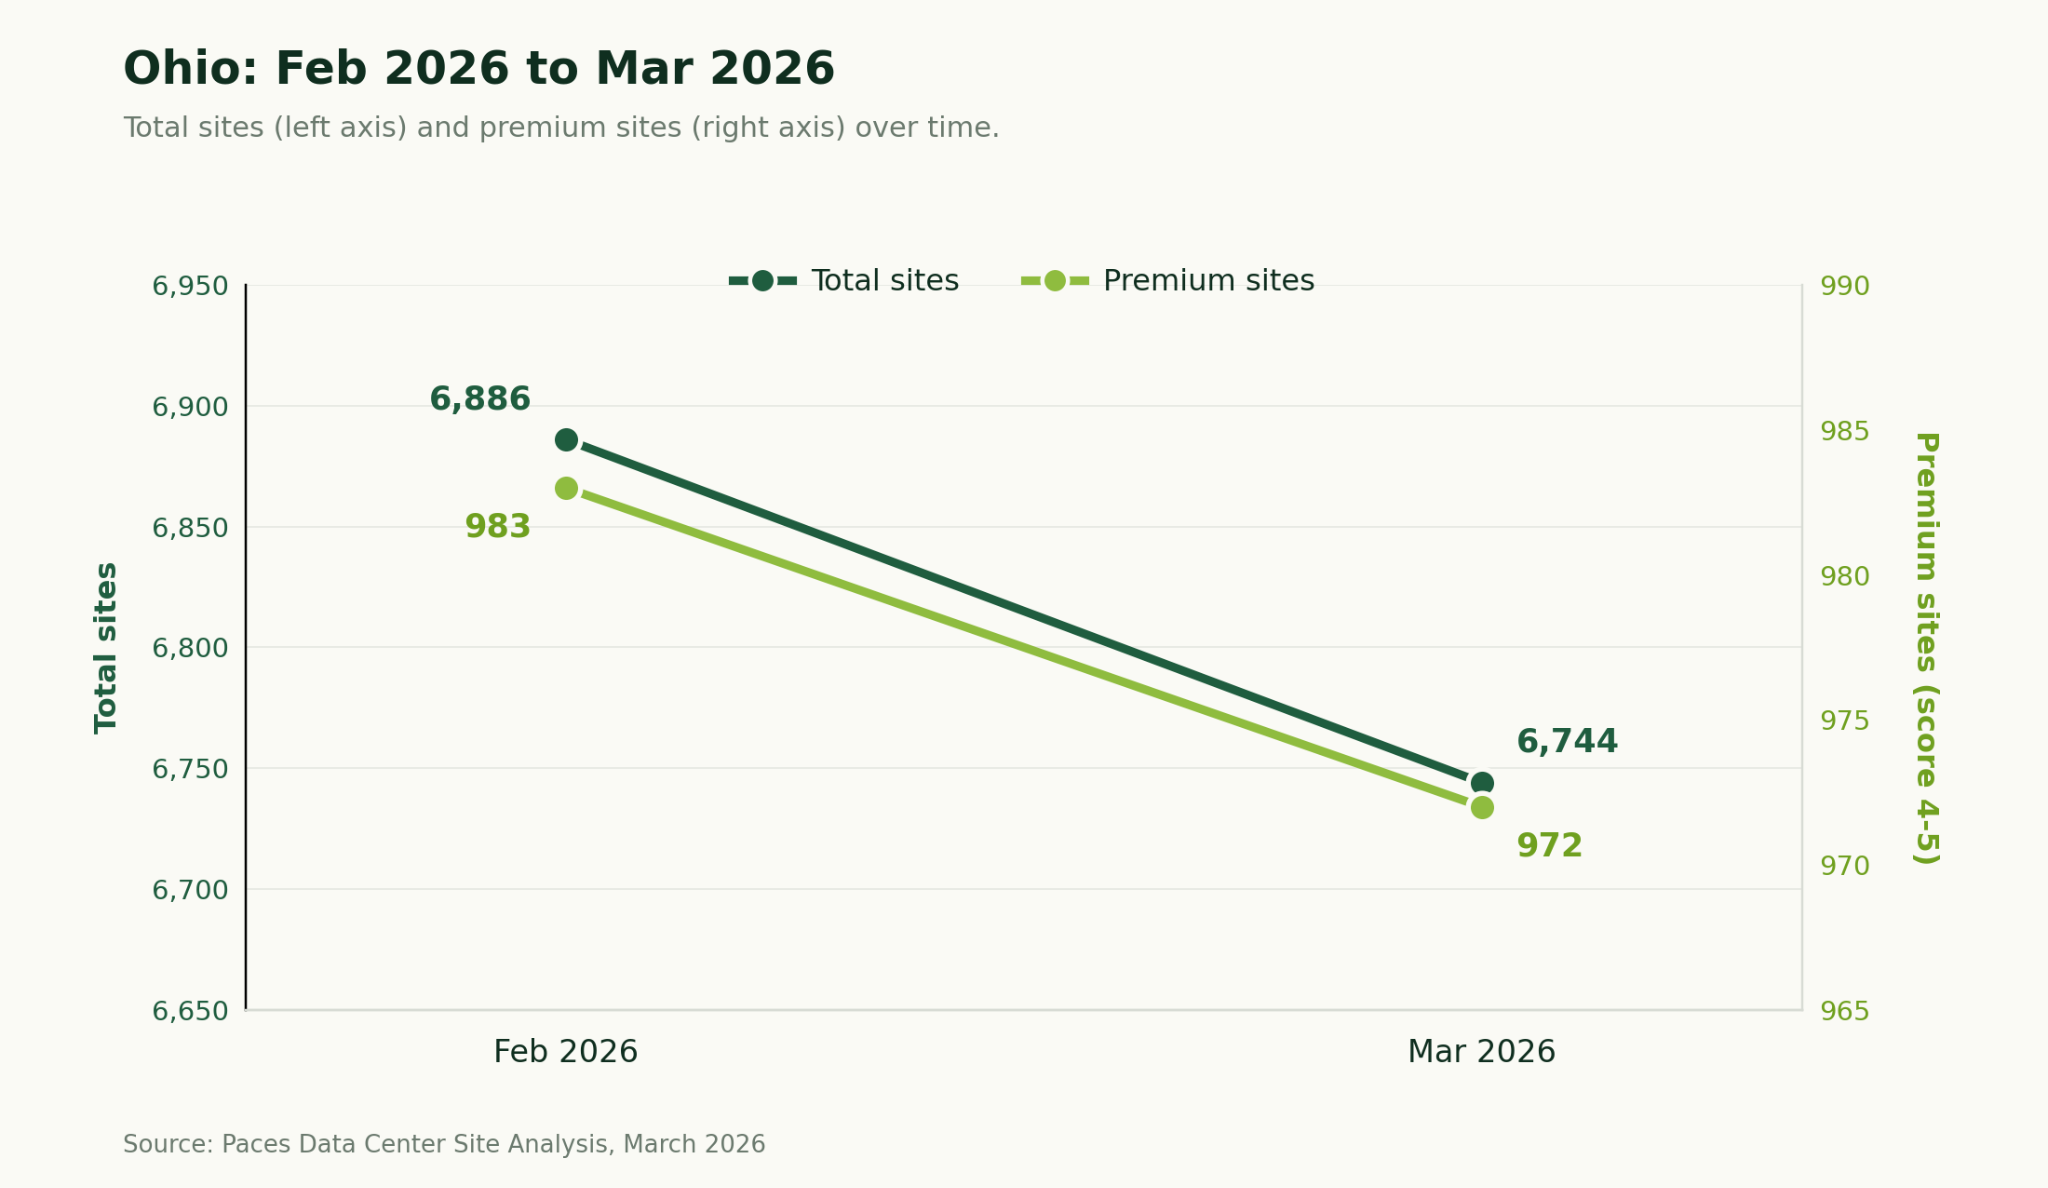
February to March: What changed
- Total sites declined from 6,886 to 6,744 (-2.1%), and premium inventory fell from 983 to 972 (-1.1%). The premium rate improved slightly from 14.3% to 14.4%, consistent with lower-quality supply exiting the pool faster.
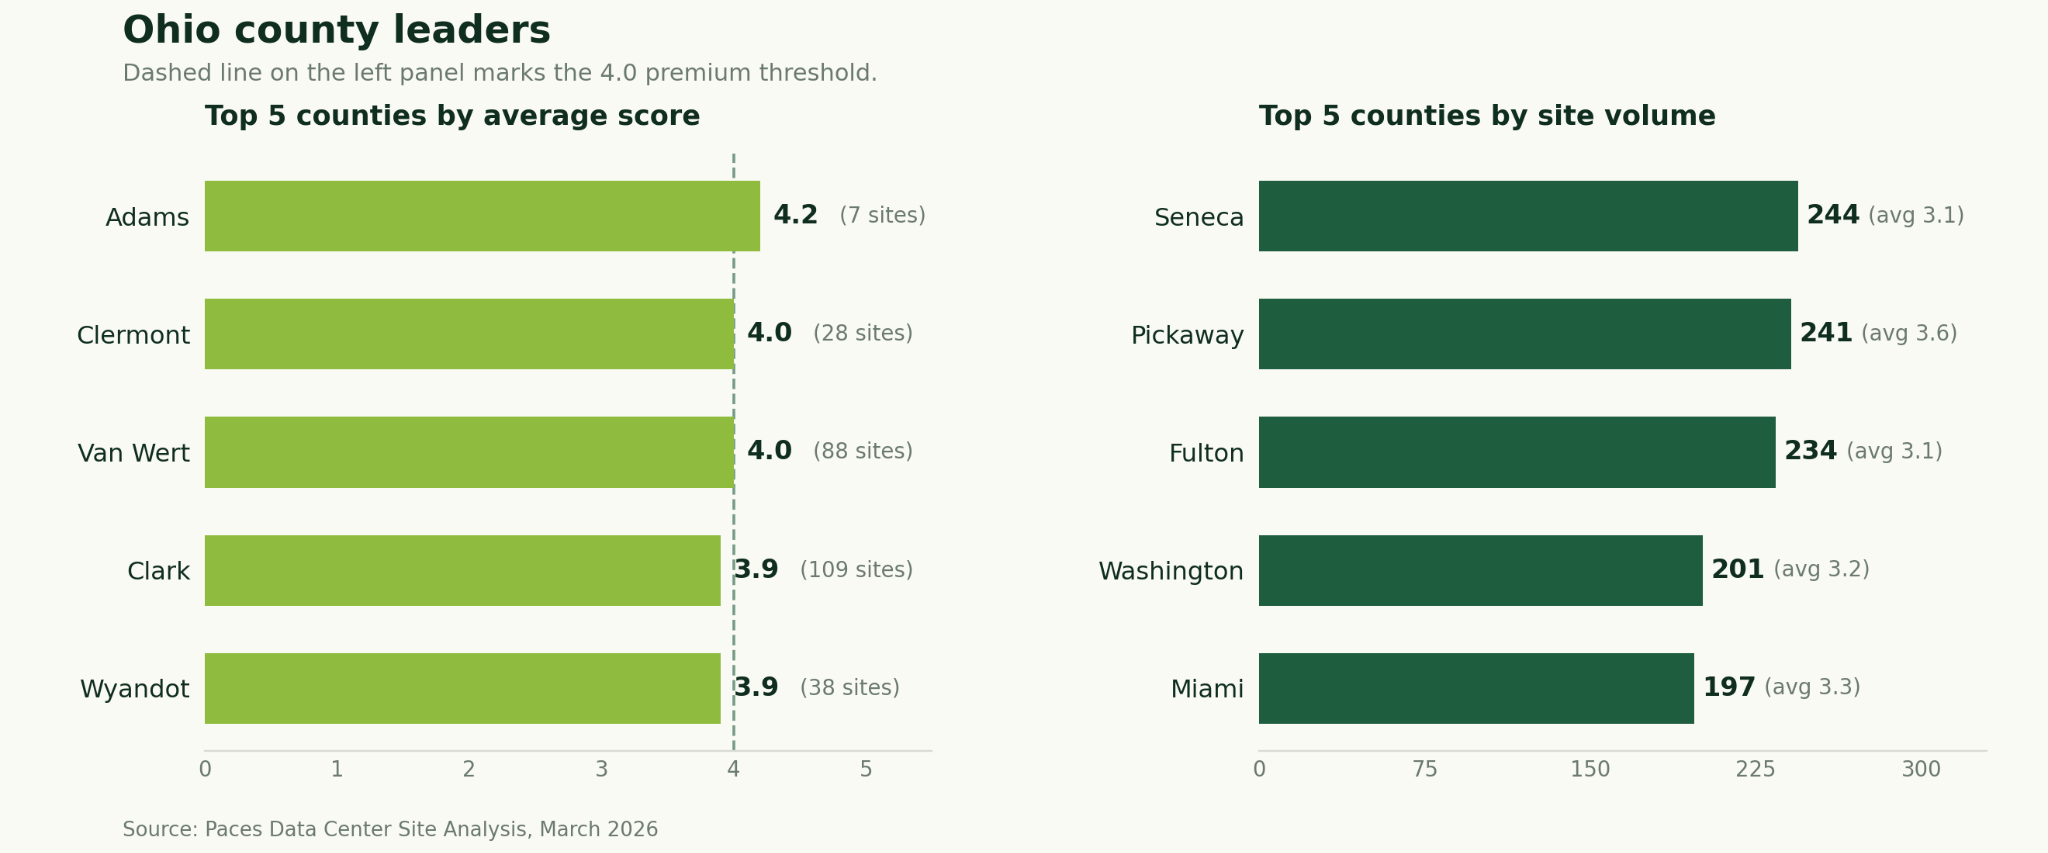
- The quality-leader tier is stable in county composition: Adams, Clermont, Van Wert, Clark, and Wyandot retained their positions. Average scores declined modestly by 0.01–0.05 points across the group.
- Volume leadership changed significantly. Seneca (244), Pickaway (241), and Fulton (234) displaced the February leaders, reflecting updated parcel screening. Pickaway County in particular stands out with 241 sites at a 3.65 average, one of the strongest quality-volume combinations in the state.
Key takeaways for Ohio
- Ohio contains 6,744 tracked sites, the most of any state in this report. 14.4% of sites (972) score 4.0 or above (Premium threshold).
- Adams County leads in average site score (4.19) with 7 sites.
- Seneca County leads in total site volume (244 sites, avg score 3.14).
- Pickaway County (241 sites, avg 3.65) stands out as the strongest dual-signal county. A top-5 in volume with above-average quality. Developers with February pipelines should re-screen against updated volume leaders.
Oklahoma
Oklahoma enters the report as the second largest markets by total site count of the ten state analysis, with 6,335 sites. The state's premium rate of 12.5% sits near the lower end of the ten-state range, but the premium count of 794 sites is the third-highest in the report, a function of raw scale. The most distinctive structural feature is the outsized concentration of sites in a small number of counties: Garfield and Beaver counties each appear in both the quality and volume top-five, with 483 and 374 sites respectively at a 3.74 average. That dual-signal profile is unusual at this site count and makes both counties strong initial screening targets. Woods County is the only one to reach the 4.0 average threshold, with 34 sites offering a narrow but confirmed premium tier.

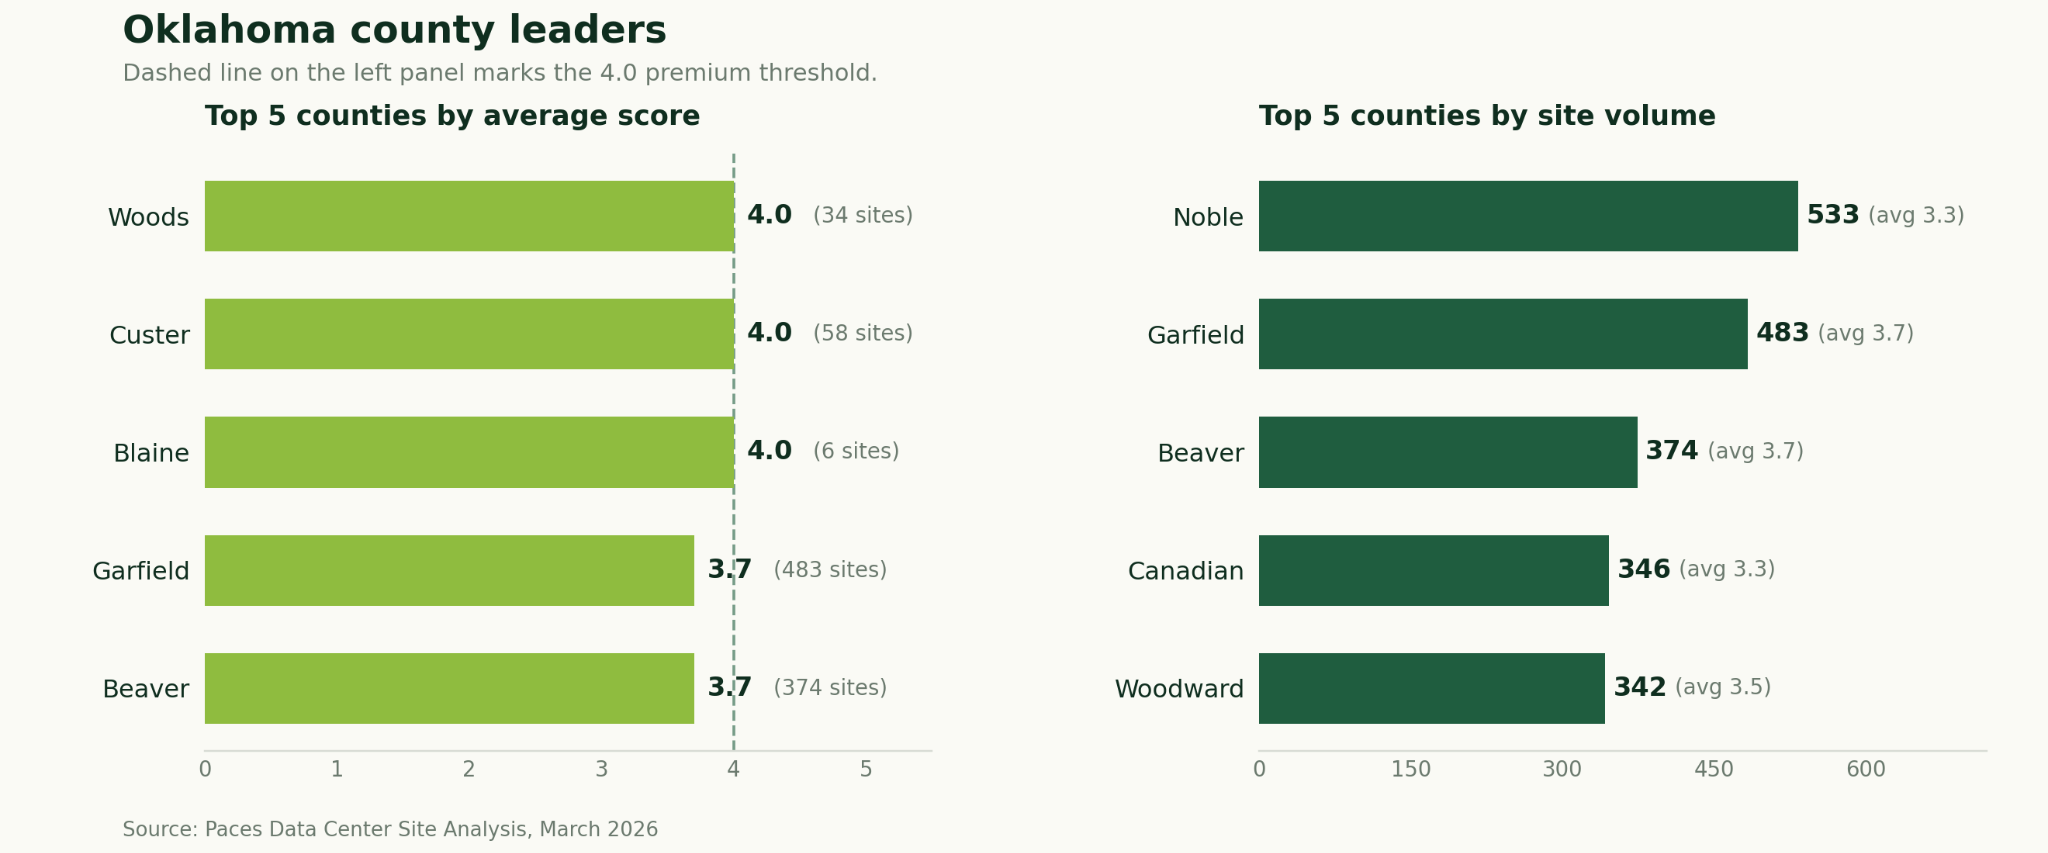
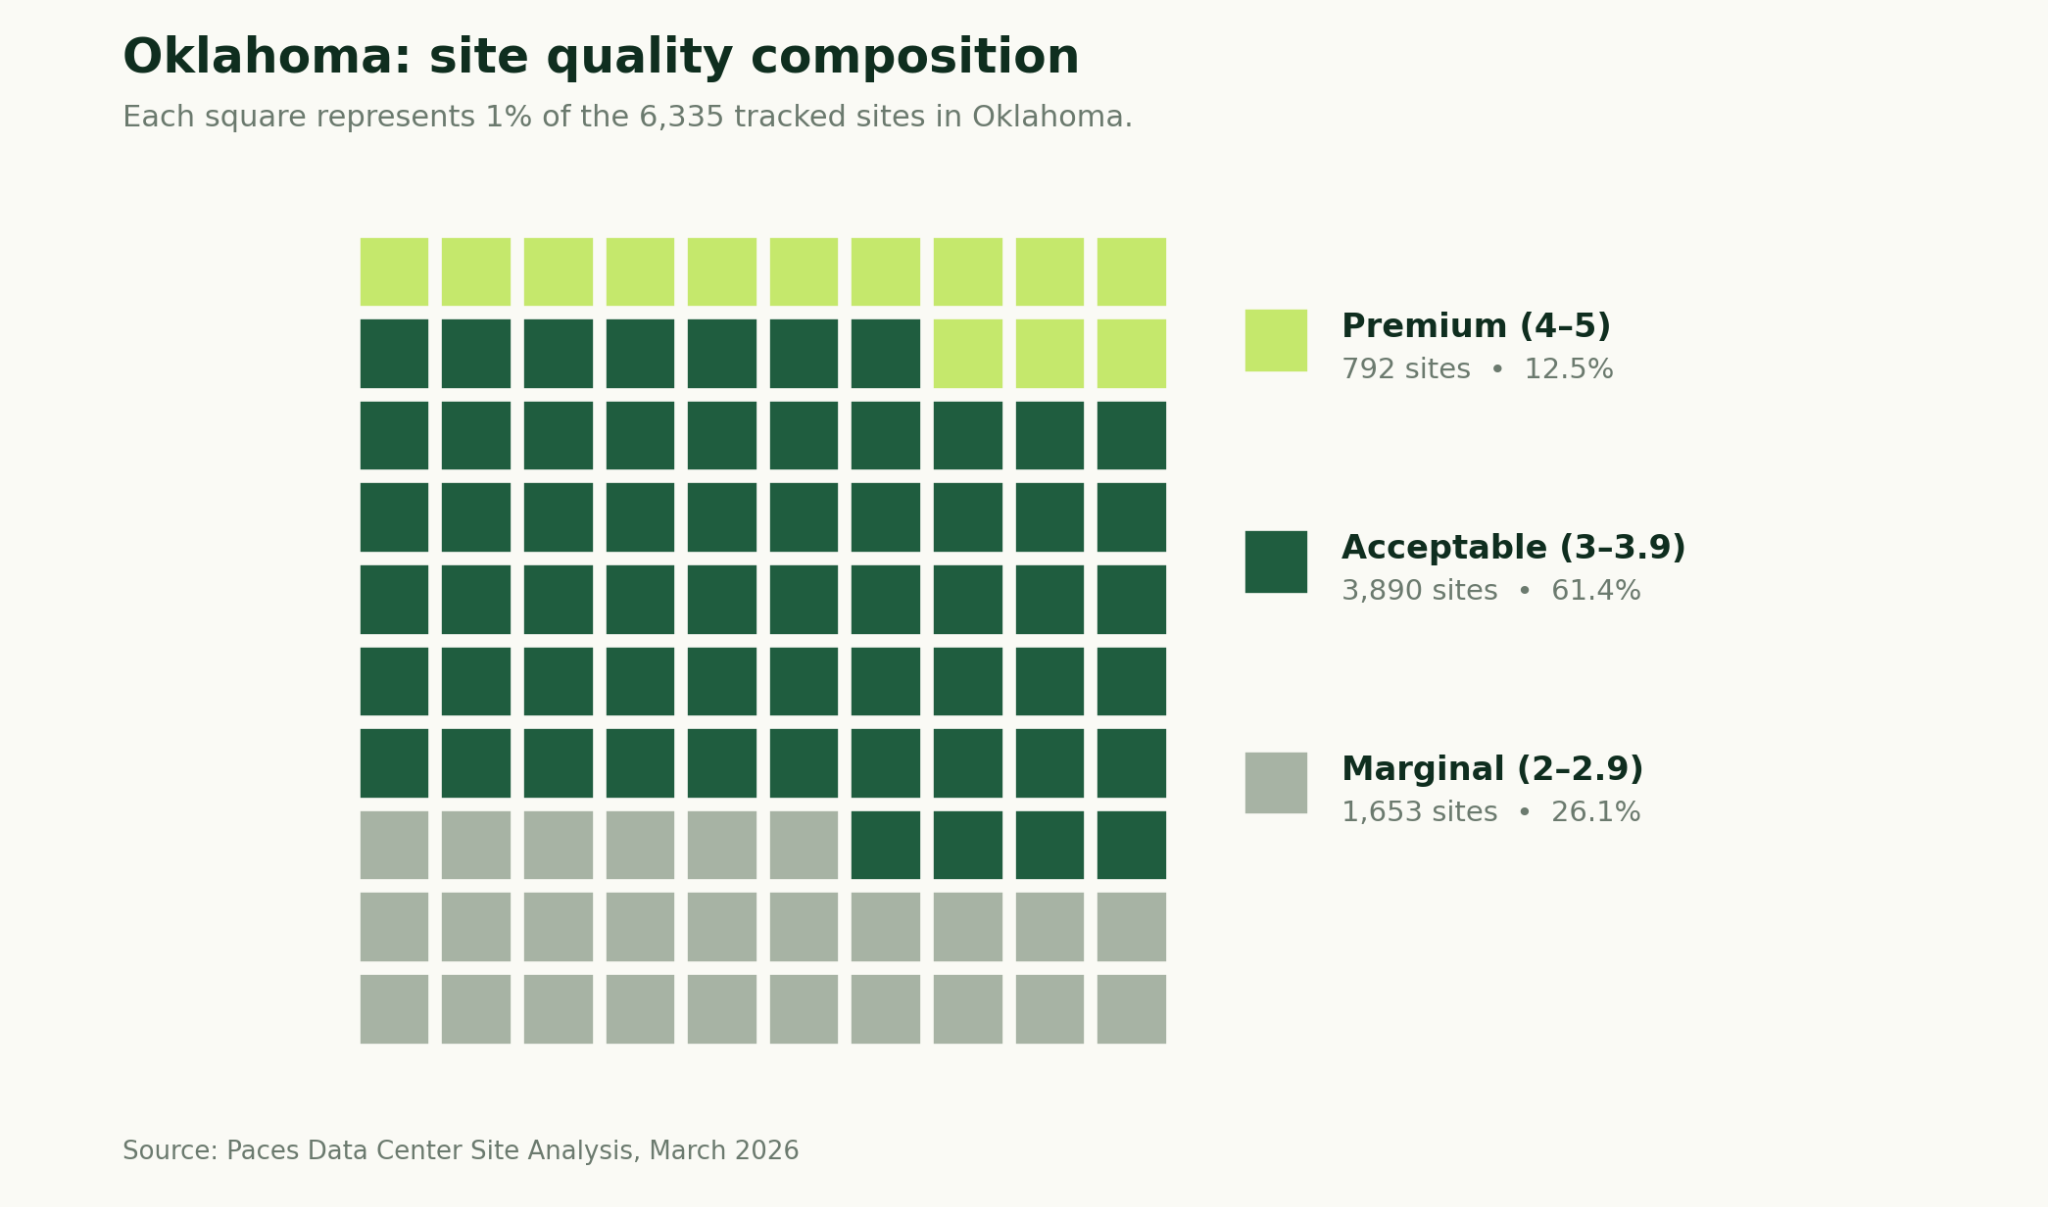
Key takeaways for Oklahoma
- Woods County leads in average site score (4.0) with 34 sites — the only county in the state to reach the premium threshold on average.
- Noble County leads in total site volume (533 sites, avg score 3.31).
- Garfield County (483 sites, avg 3.74) and Beaver County (374 sites, avg 3.74) both appear in the top five for quality and volume, offering the strongest combination of scale and above-average quality in the state.
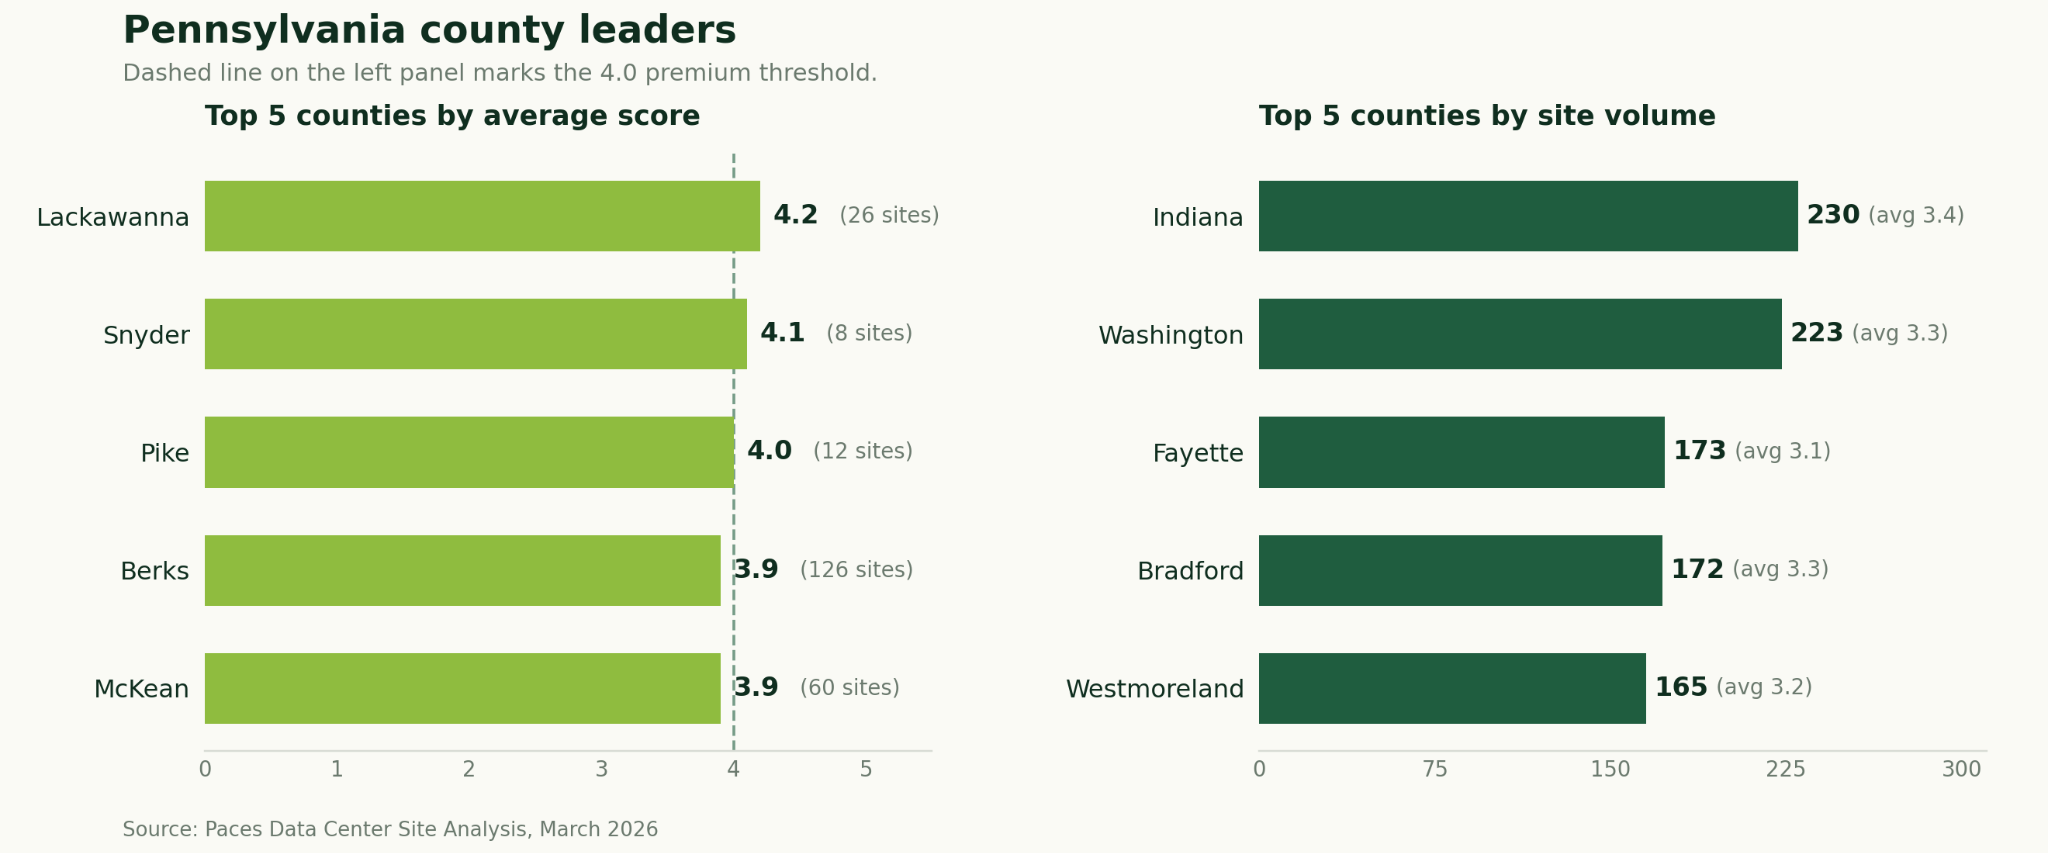
Pennsylvania
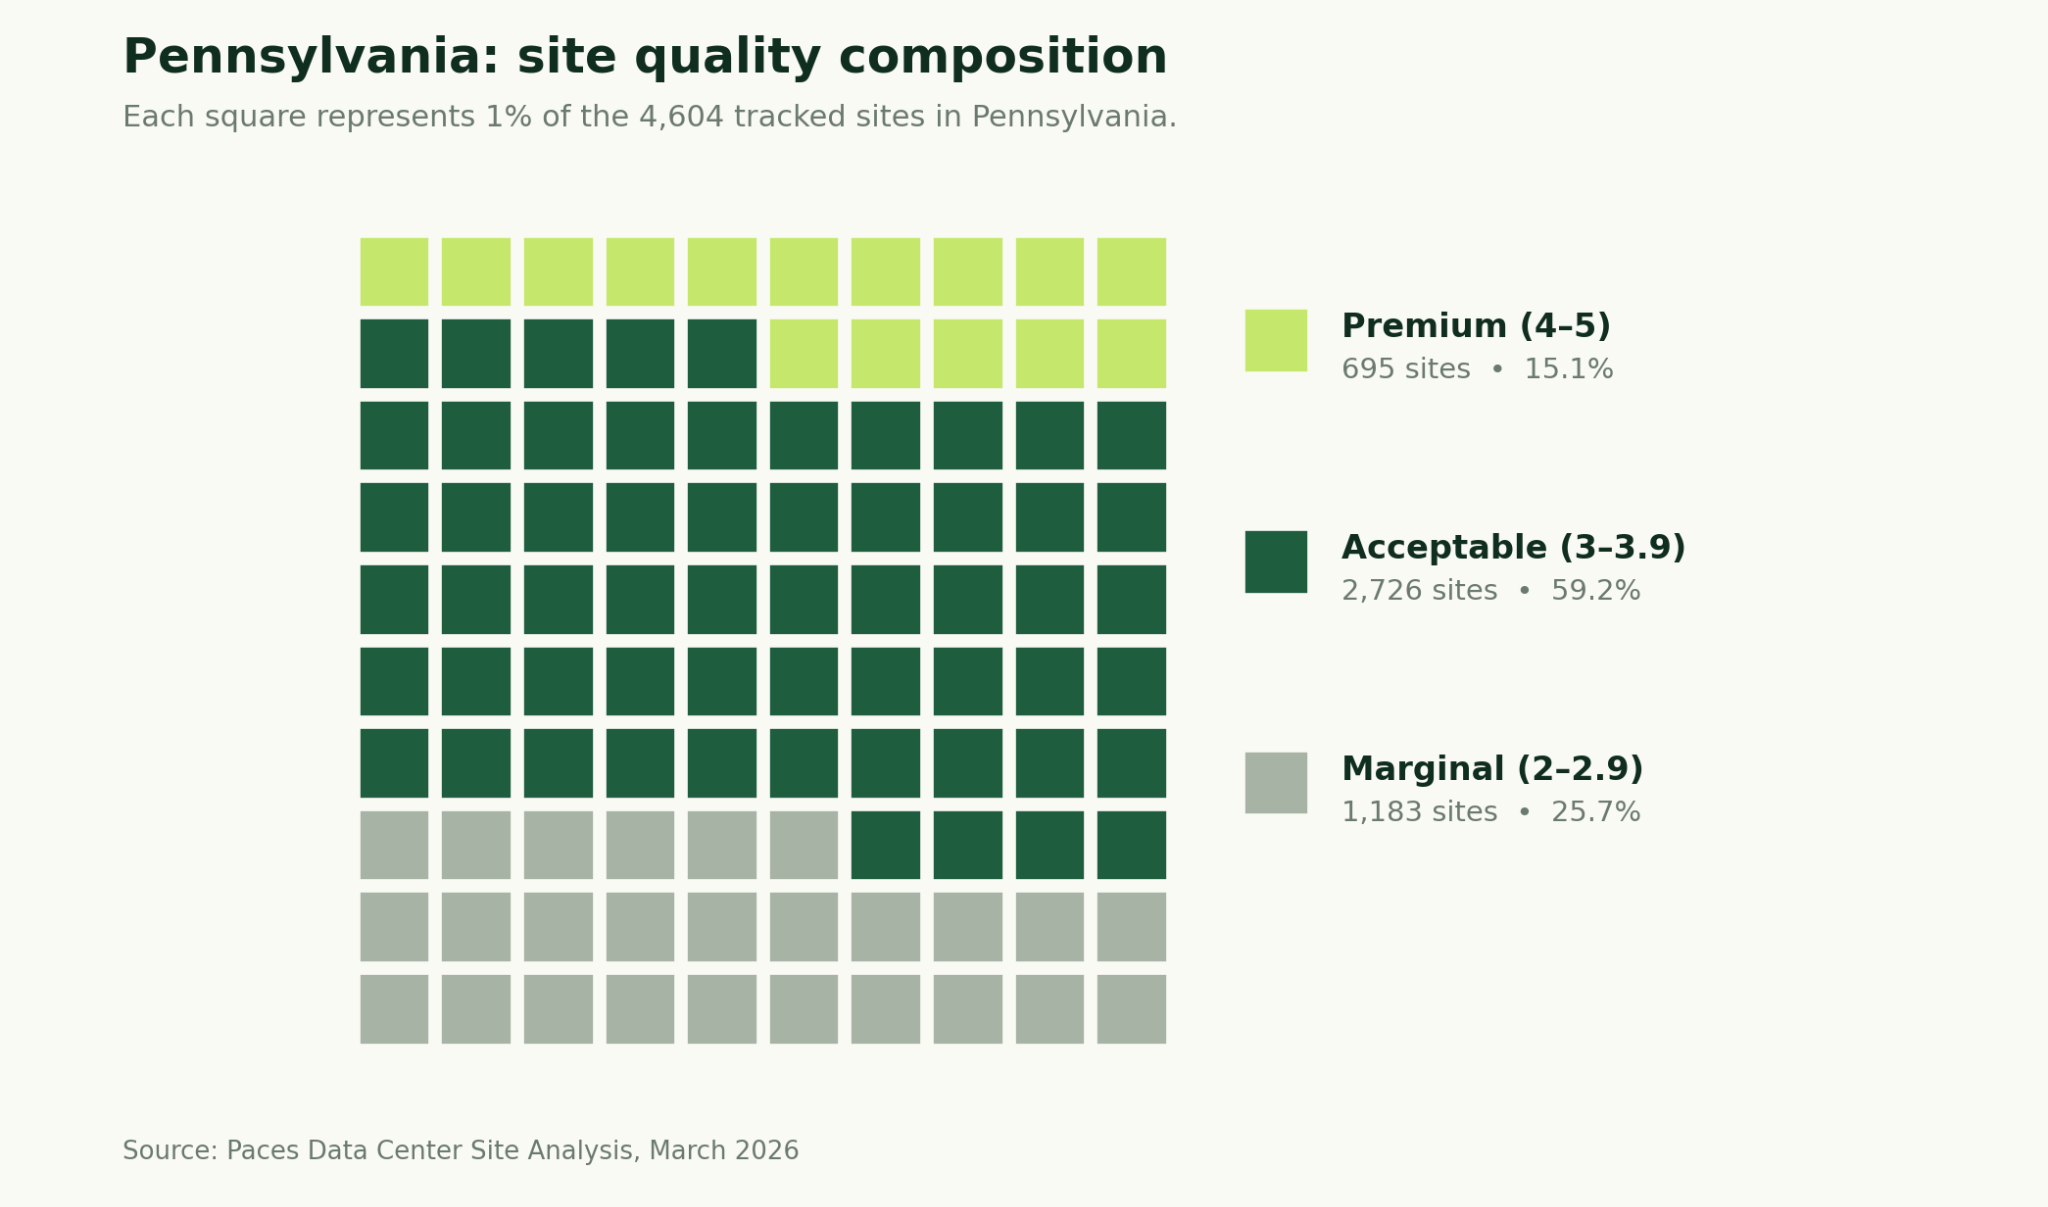
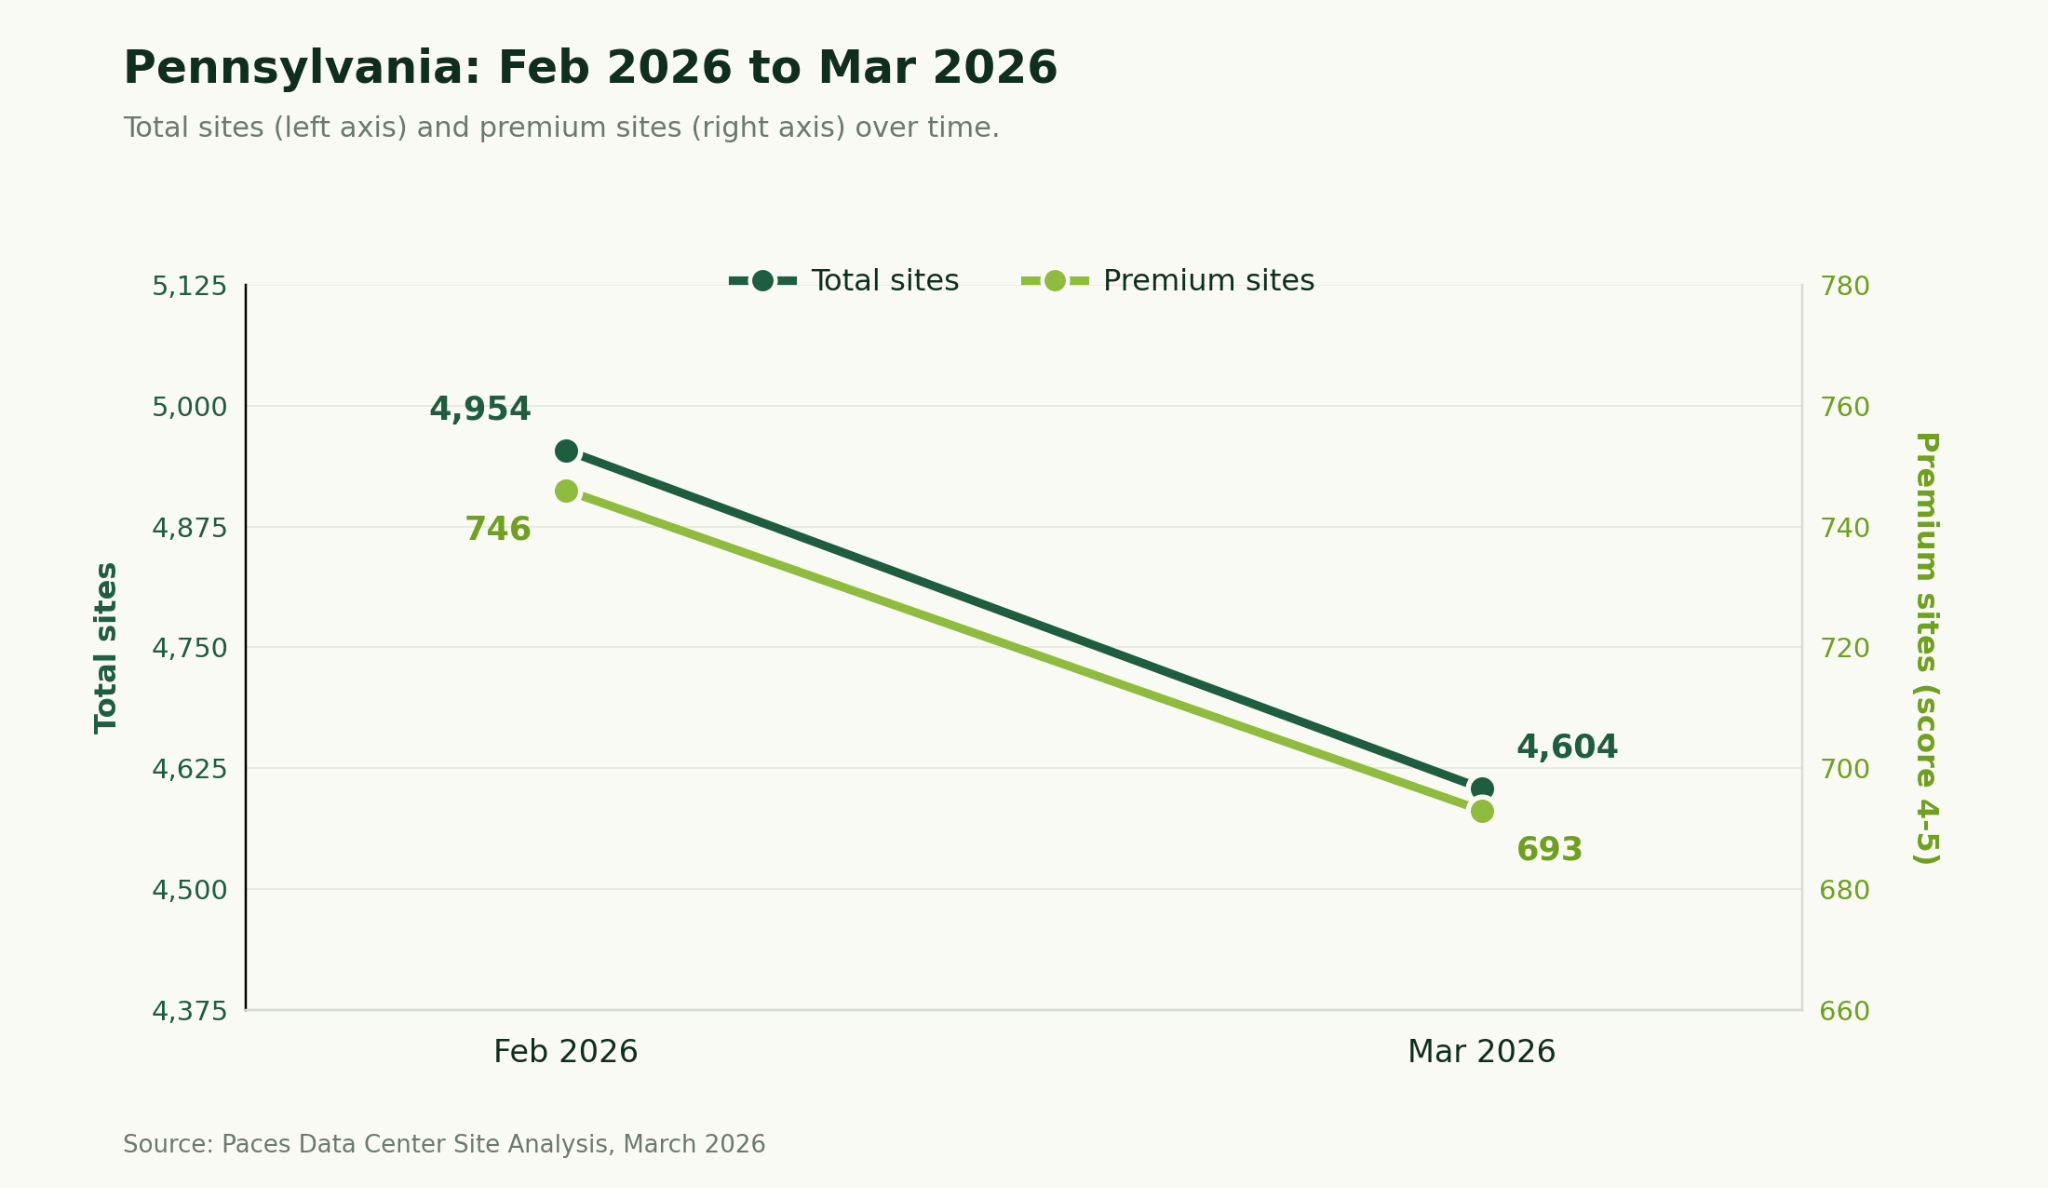
Pennsylvania posts the largest absolute site count decline of any returning state in March, shedding 350 sites (-7.1%). Despite that contraction, the premium rate held exactly flat at 15.1%. A signal that the inventory leaving the pool is concentrated in the marginal and acceptable tiers, not premium. The quality-leader tier is largely intact, with the same top three counties (Lackawanna, Snyder, Pike) in the same order. McKean County's entry into the top-5 by score at 3.93 adds a northern Pennsylvania option to the quality tier worth monitoring.
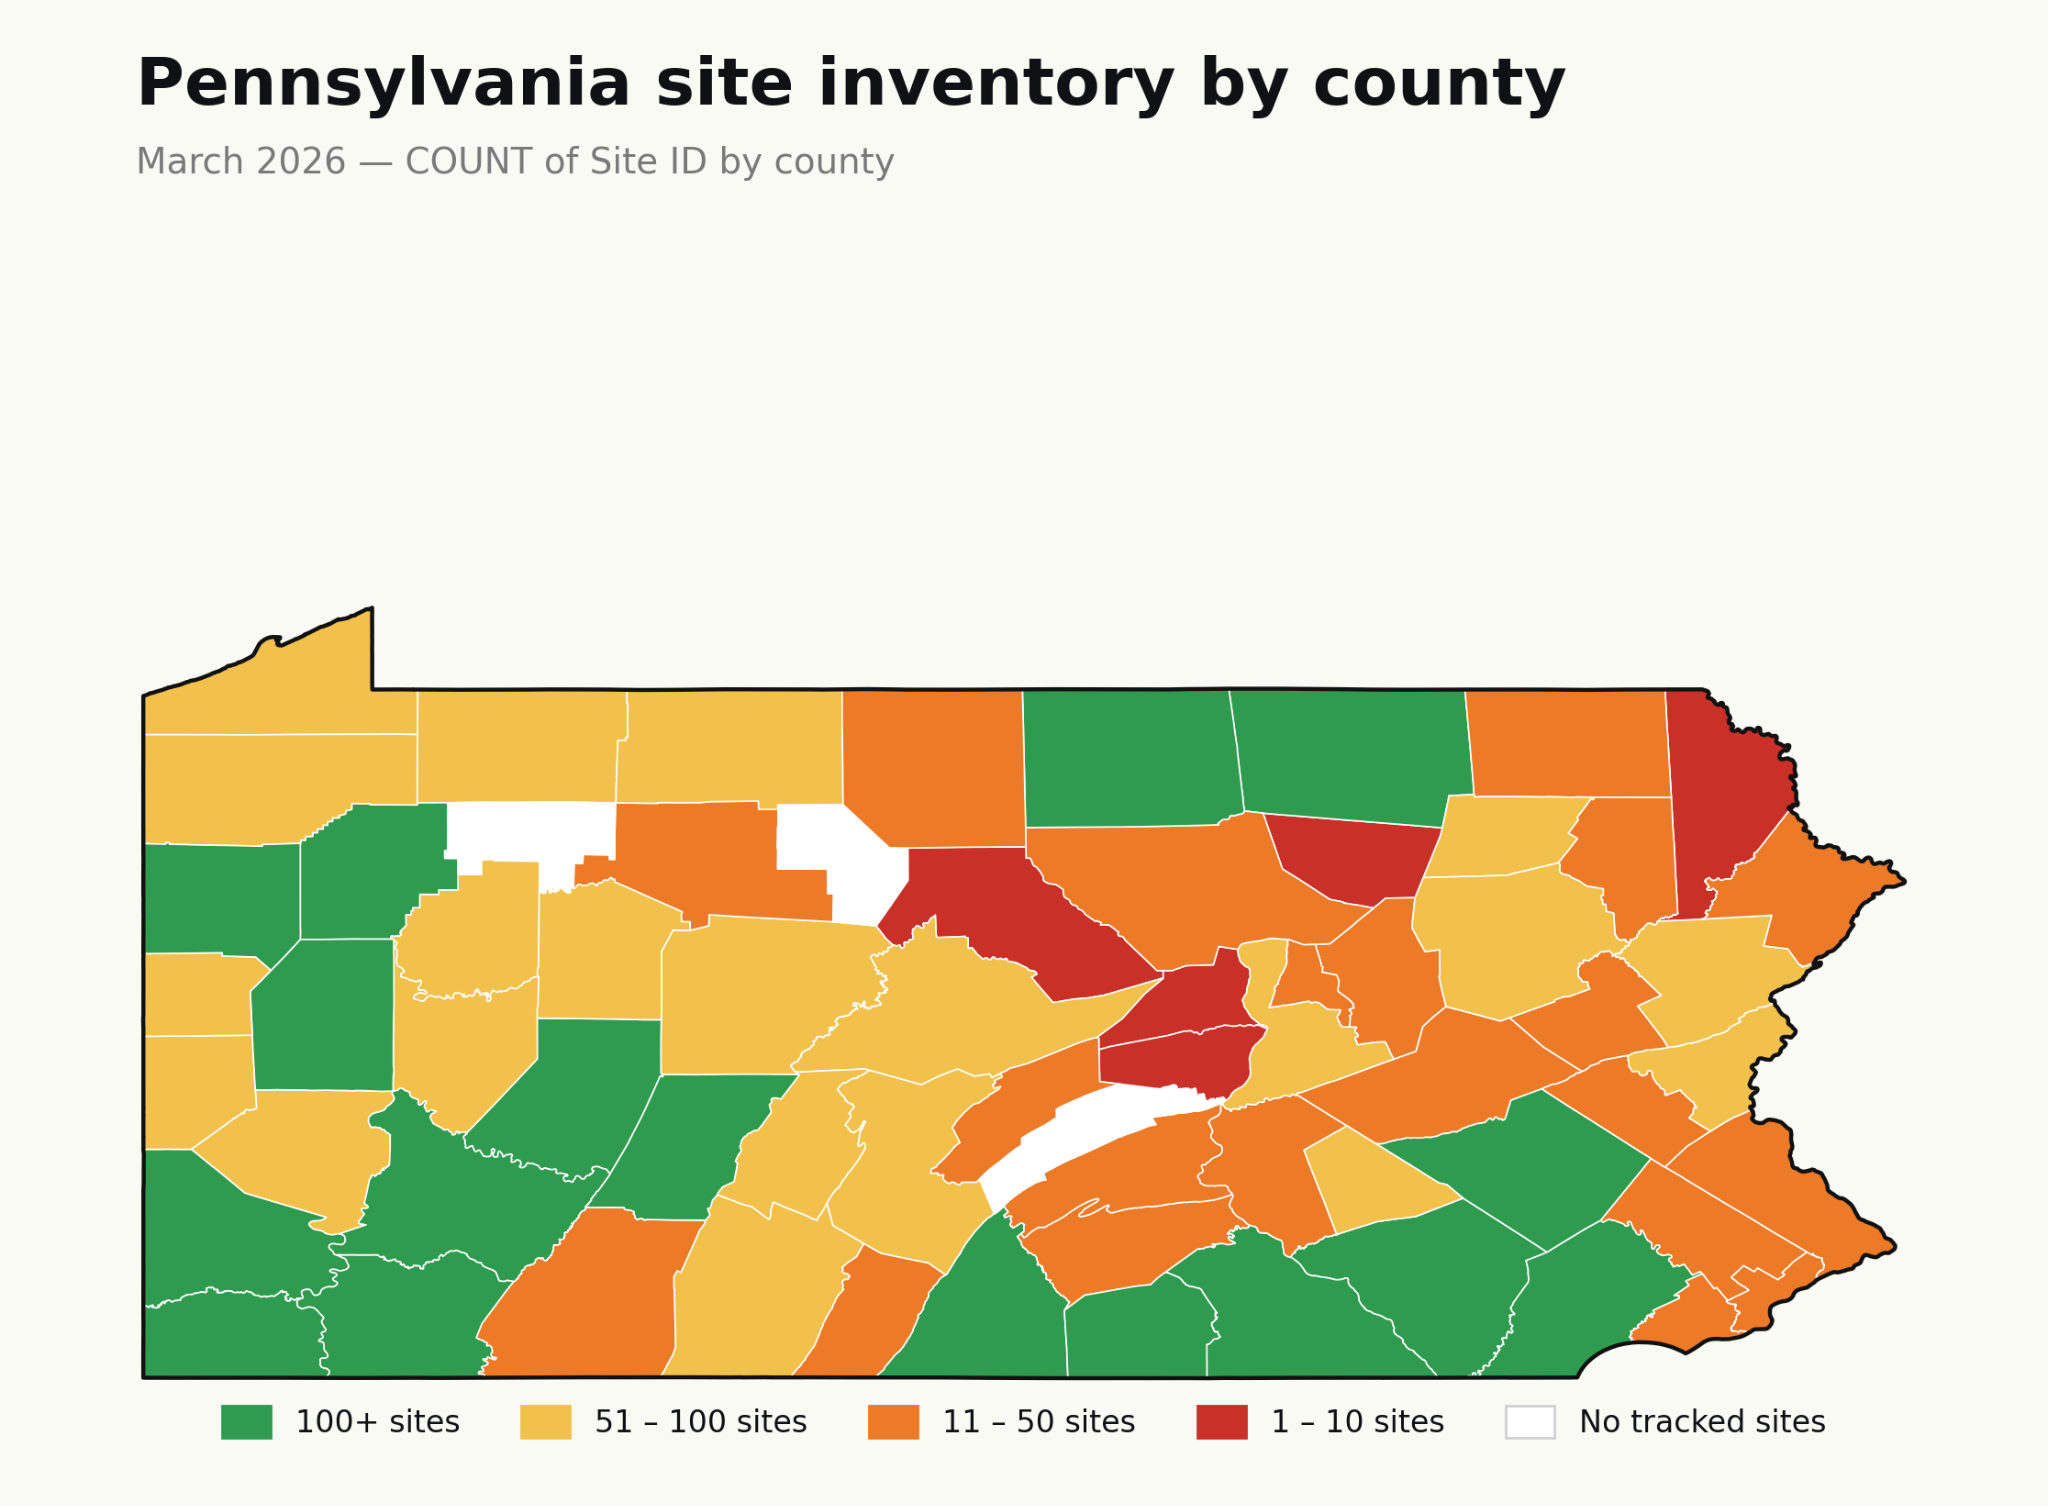
February to March: What changed
- Total sites fell from 4,954 to 4,604 (-7.1%), and premium inventory declined from 746 to 693 (-7.1%). The premium rate held flat at 15.1%, indicating proportional contraction across the inventory.
- Lackawanna, Snyder, and Pike retained the top three quality positions. McKean County (3.93 avg, 60 sites) replaced York at #5, adding a northern PA option at just below the 4.0 threshold.
- Volume leadership is consistent: the same five counties appear in the same order, each losing 10–20 sites. Indiana County (230 sites, avg 3.37) retains the lead and the quality advantage that makes it the state's strongest dual-signal county.
Key takeaways for Pennsylvania
- Pennsylvania contains 4,604 tracked sites across PJM. 15.1% of sites (693) score 4.0 or above (Premium threshold).
- Lackawanna County leads in average site score (4.22) with 26 sites.
- Indiana County leads in total site volume (230 sites, avg score 3.37).
- The premium rate held flat despite a 7.1% total inventory decline — the attrition is concentrated in lower-quality supply, leaving the premium pool relatively intact.
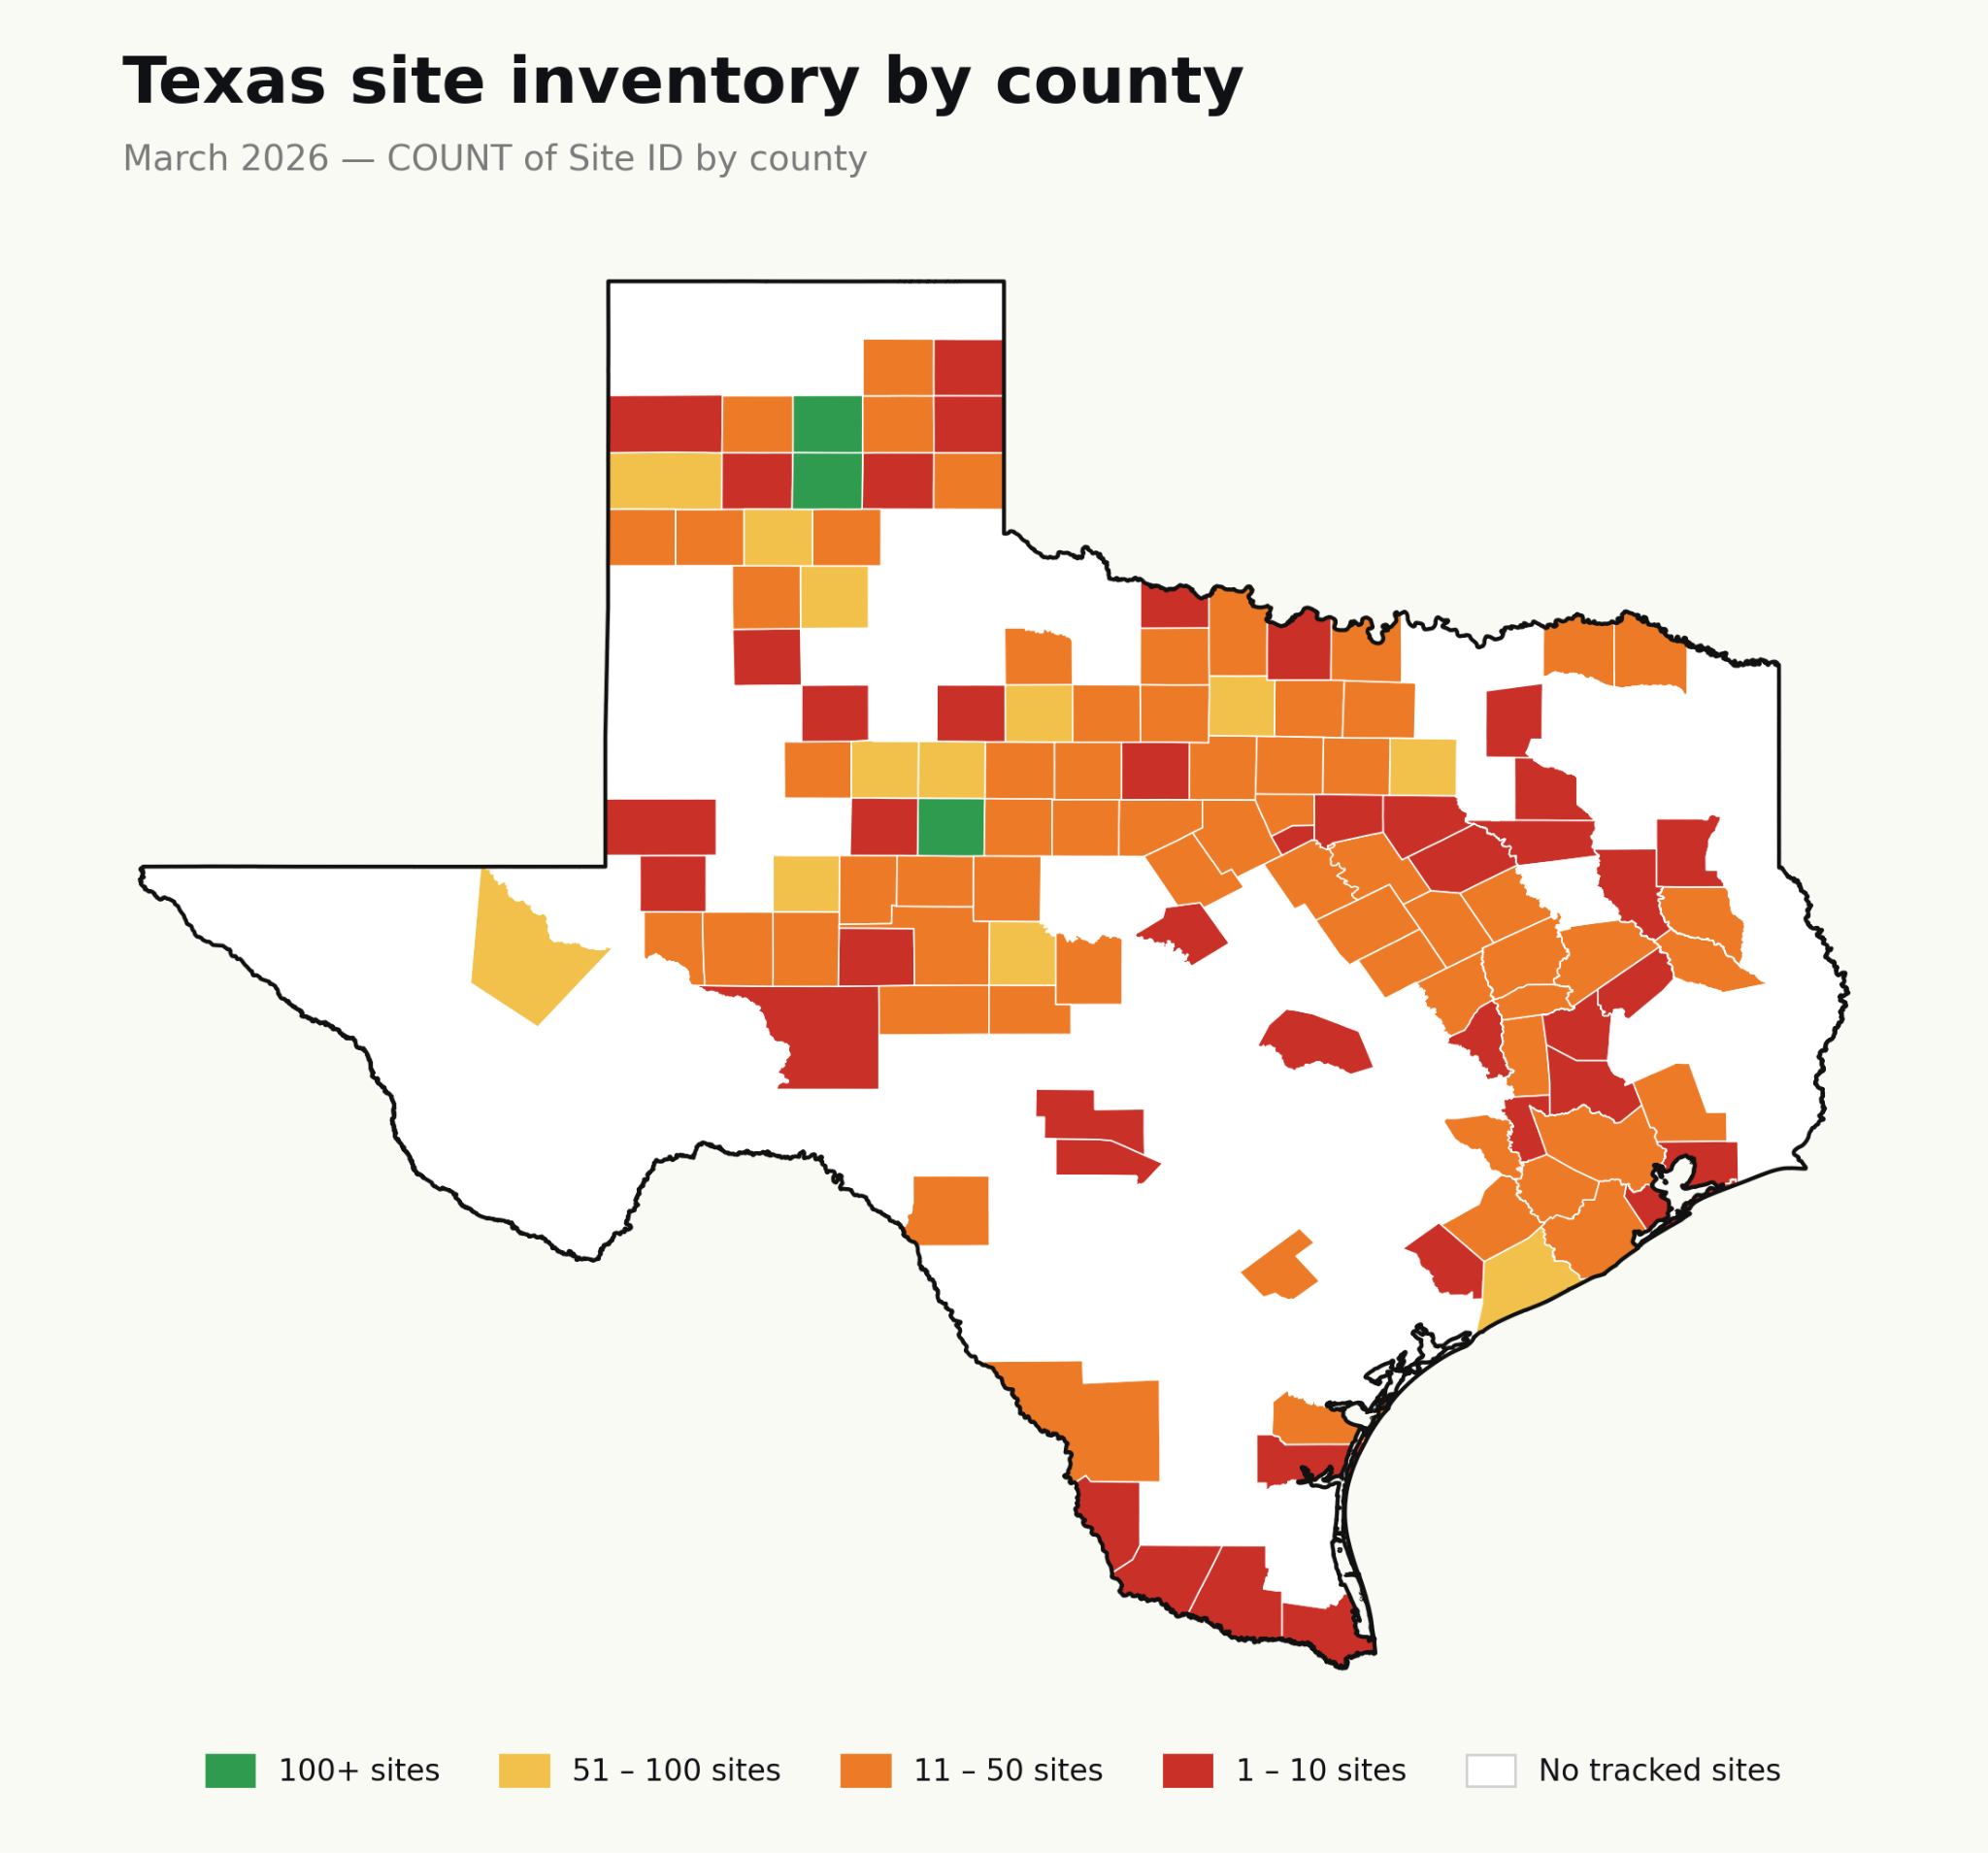
Texas
Texas has effectively stabilized. After declining 10.9% between January and February, total inventory contracted by only 2 sites in March showing a near-complete deceleration of the drawdown trend that has defined the state since mid-2025. The premium rate held at 33.7%, and the quality leader tier remains anchored by the same West Texas counties. ERCOT's fundamental advantage over MISO and PJM remains intact: Texas is the only market in this report where the highest-volume counties consistently carry premium-tier scores, allowing developers to target scale and quality simultaneously in their search.
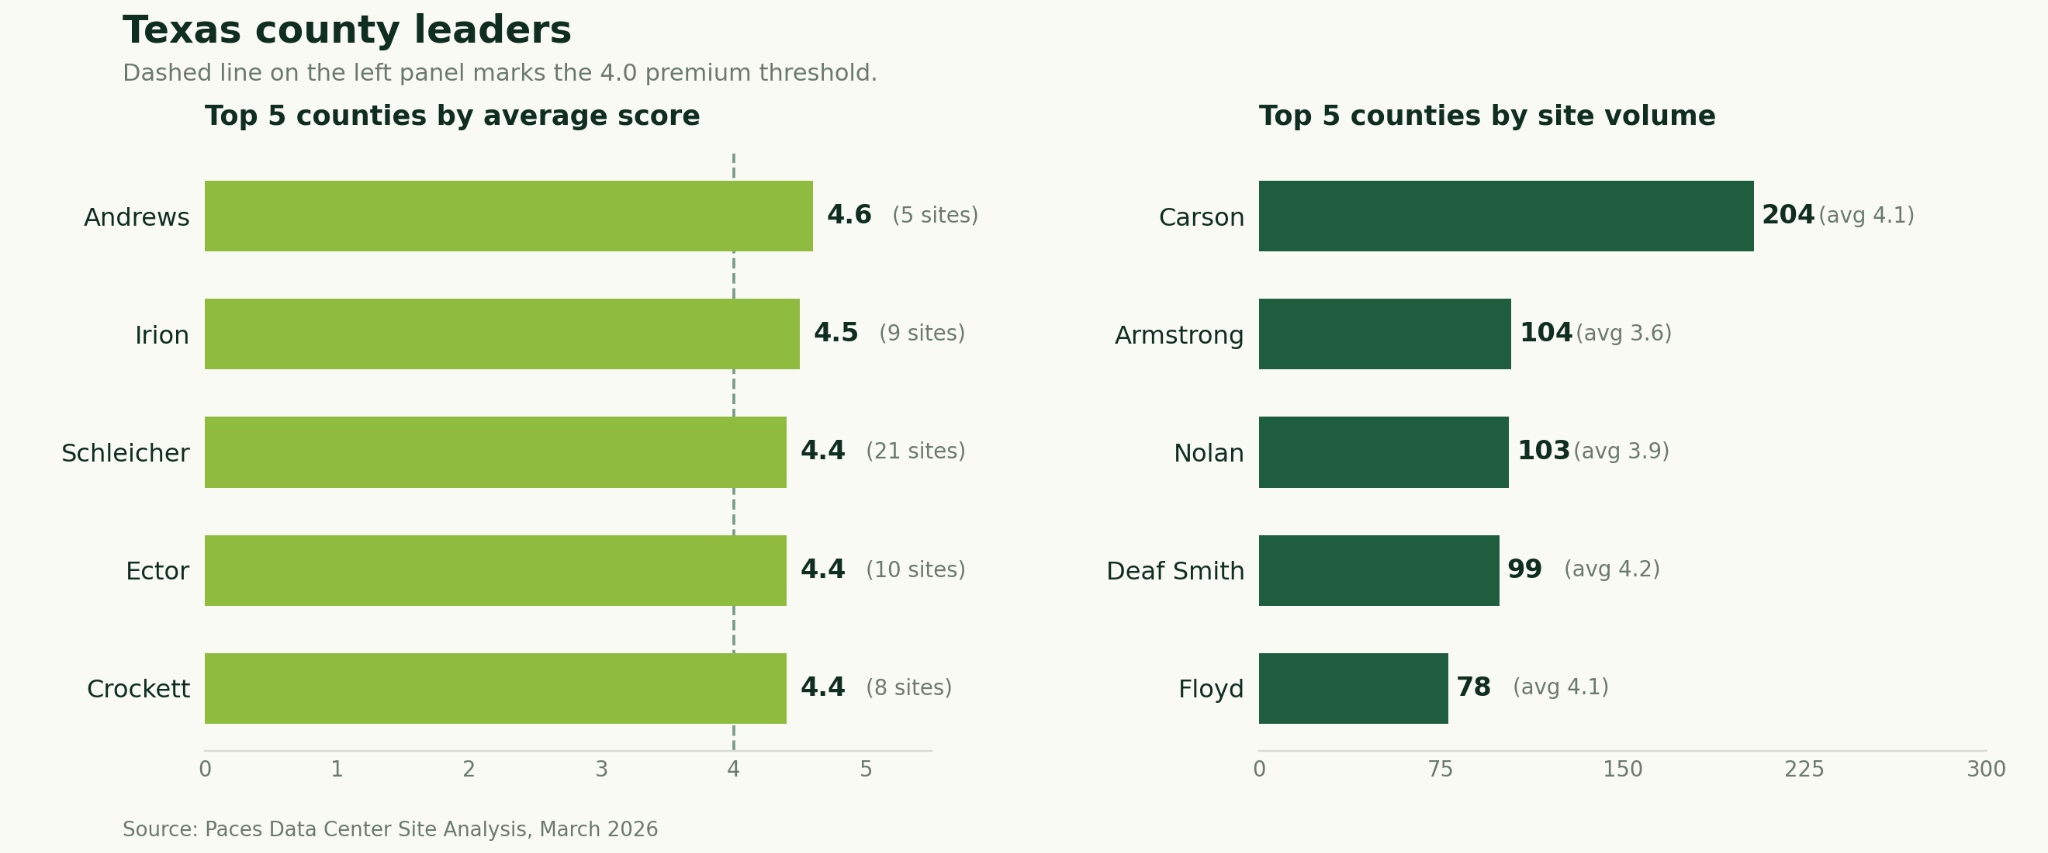
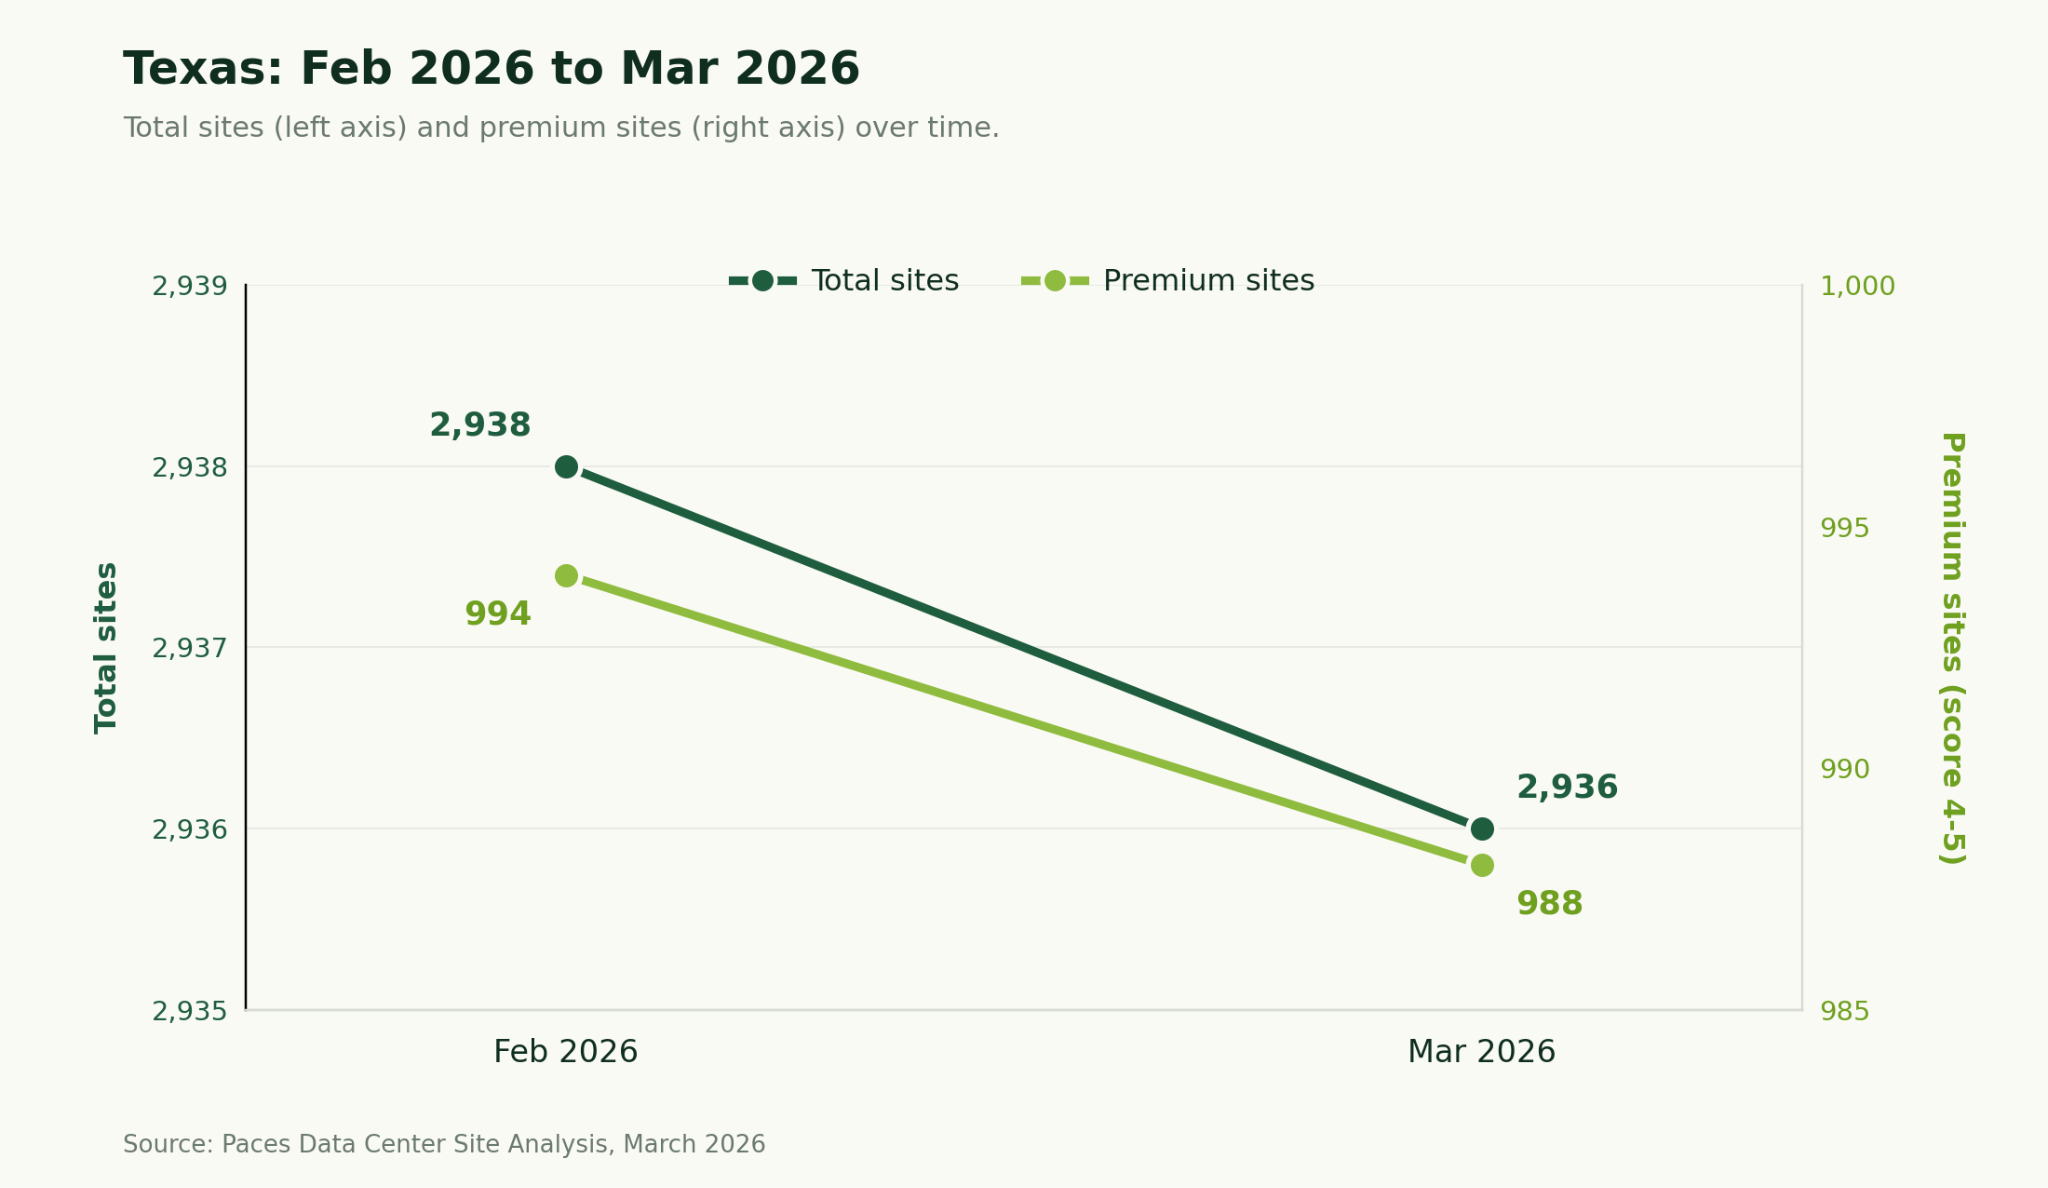
February to March: What changed
- Total sites declined by just 2, from 2,938 to 2,936 (-0.1%), effectively flat. Premium inventory declined from 994 to 988 (-0.6%), and the premium rate held at 33.7%. This represents a dramatic slowdown from the -10.9% decline seen between January and February.
- The quality-leader tier is broadly consistent: Andrews (4.6) and Irion (4.5) retained the top two positions. Schleicher (4.4, 21 sites) and Ector (4.4, 10 sites) are new entrants, displacing Starr and Jackson, which edged just below the top-5 threshold.
- Volume leadership is identical for the second consecutive month: Carson (204), Armstrong (104), Nolan (103), Deaf Smith (99), and Floyd (78) maintained their positions.
Key takeaways for Texas
- Texas contains 2,936 tracked sites across ERCOT. 33.7% of sites (988) score 4.0 or above (Premium threshold), the highest premium rate of any state in this report.
- Andrews County leads in average site score (4.6) with 5 sites.
- Carson County leads in total site volume (204 sites, avg score 4.1) — a rare combination of scale and premium-tier quality.
- Texas inventory appears to have stabilized following months of decline. The premium rate has held above 33% for three consecutive cycles.
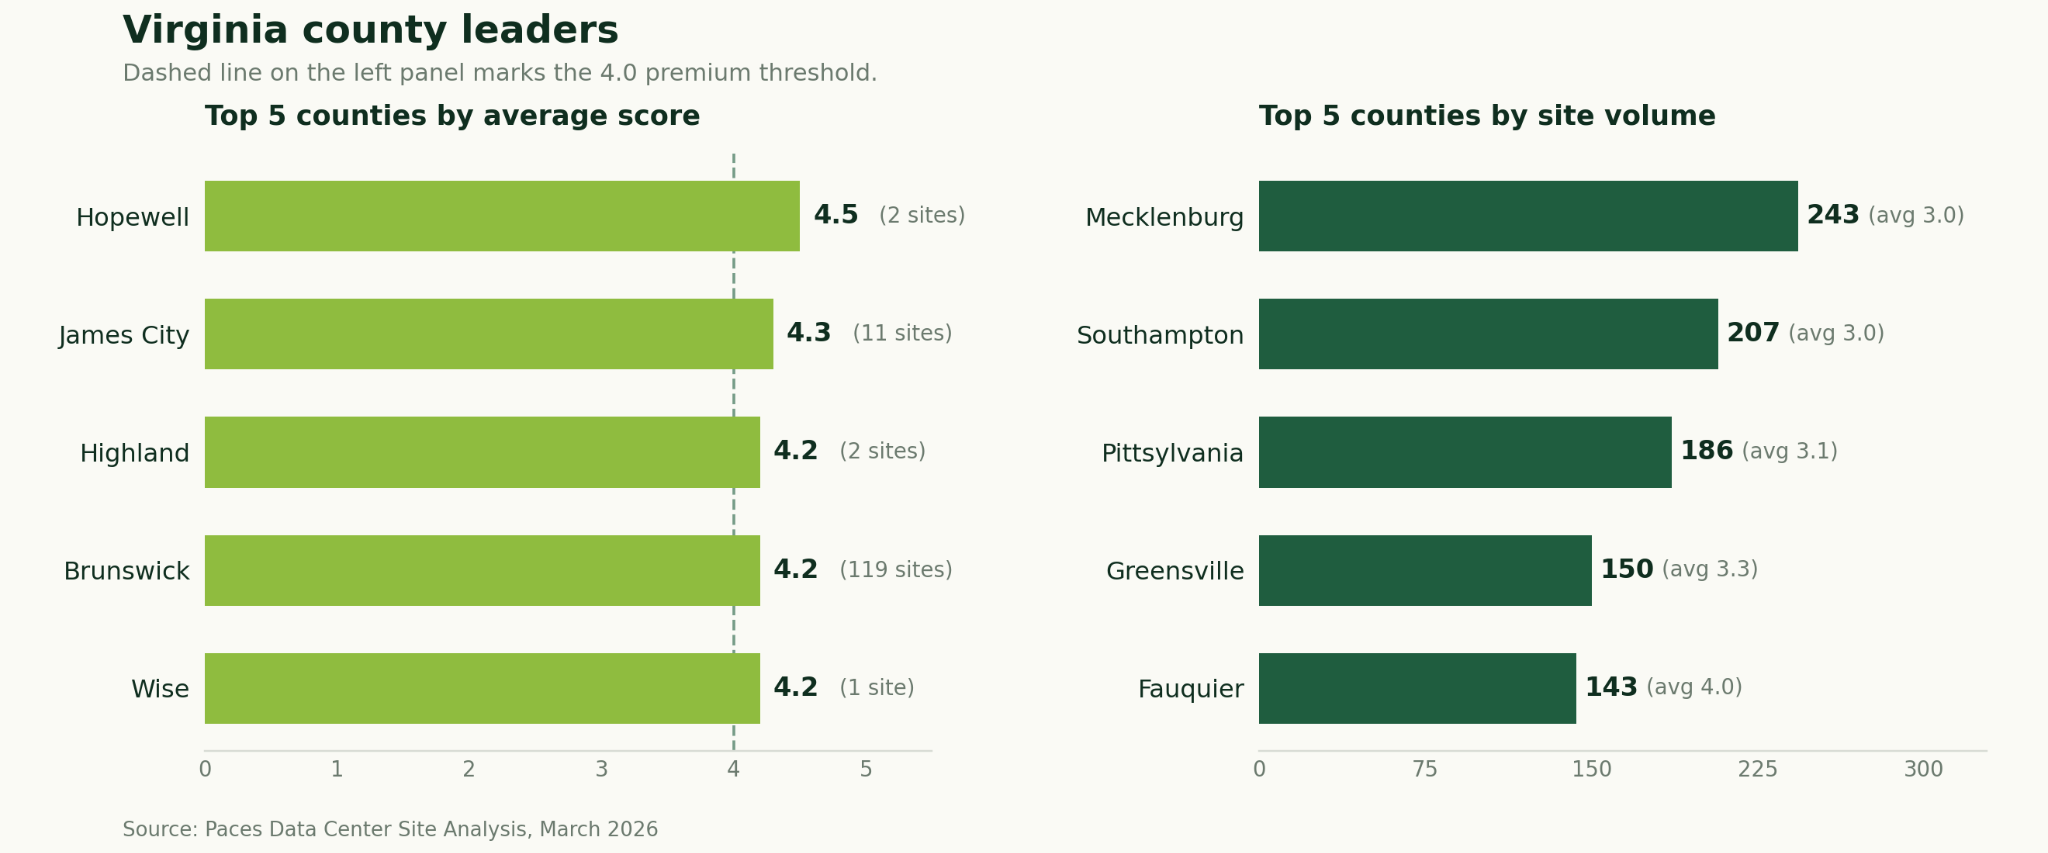
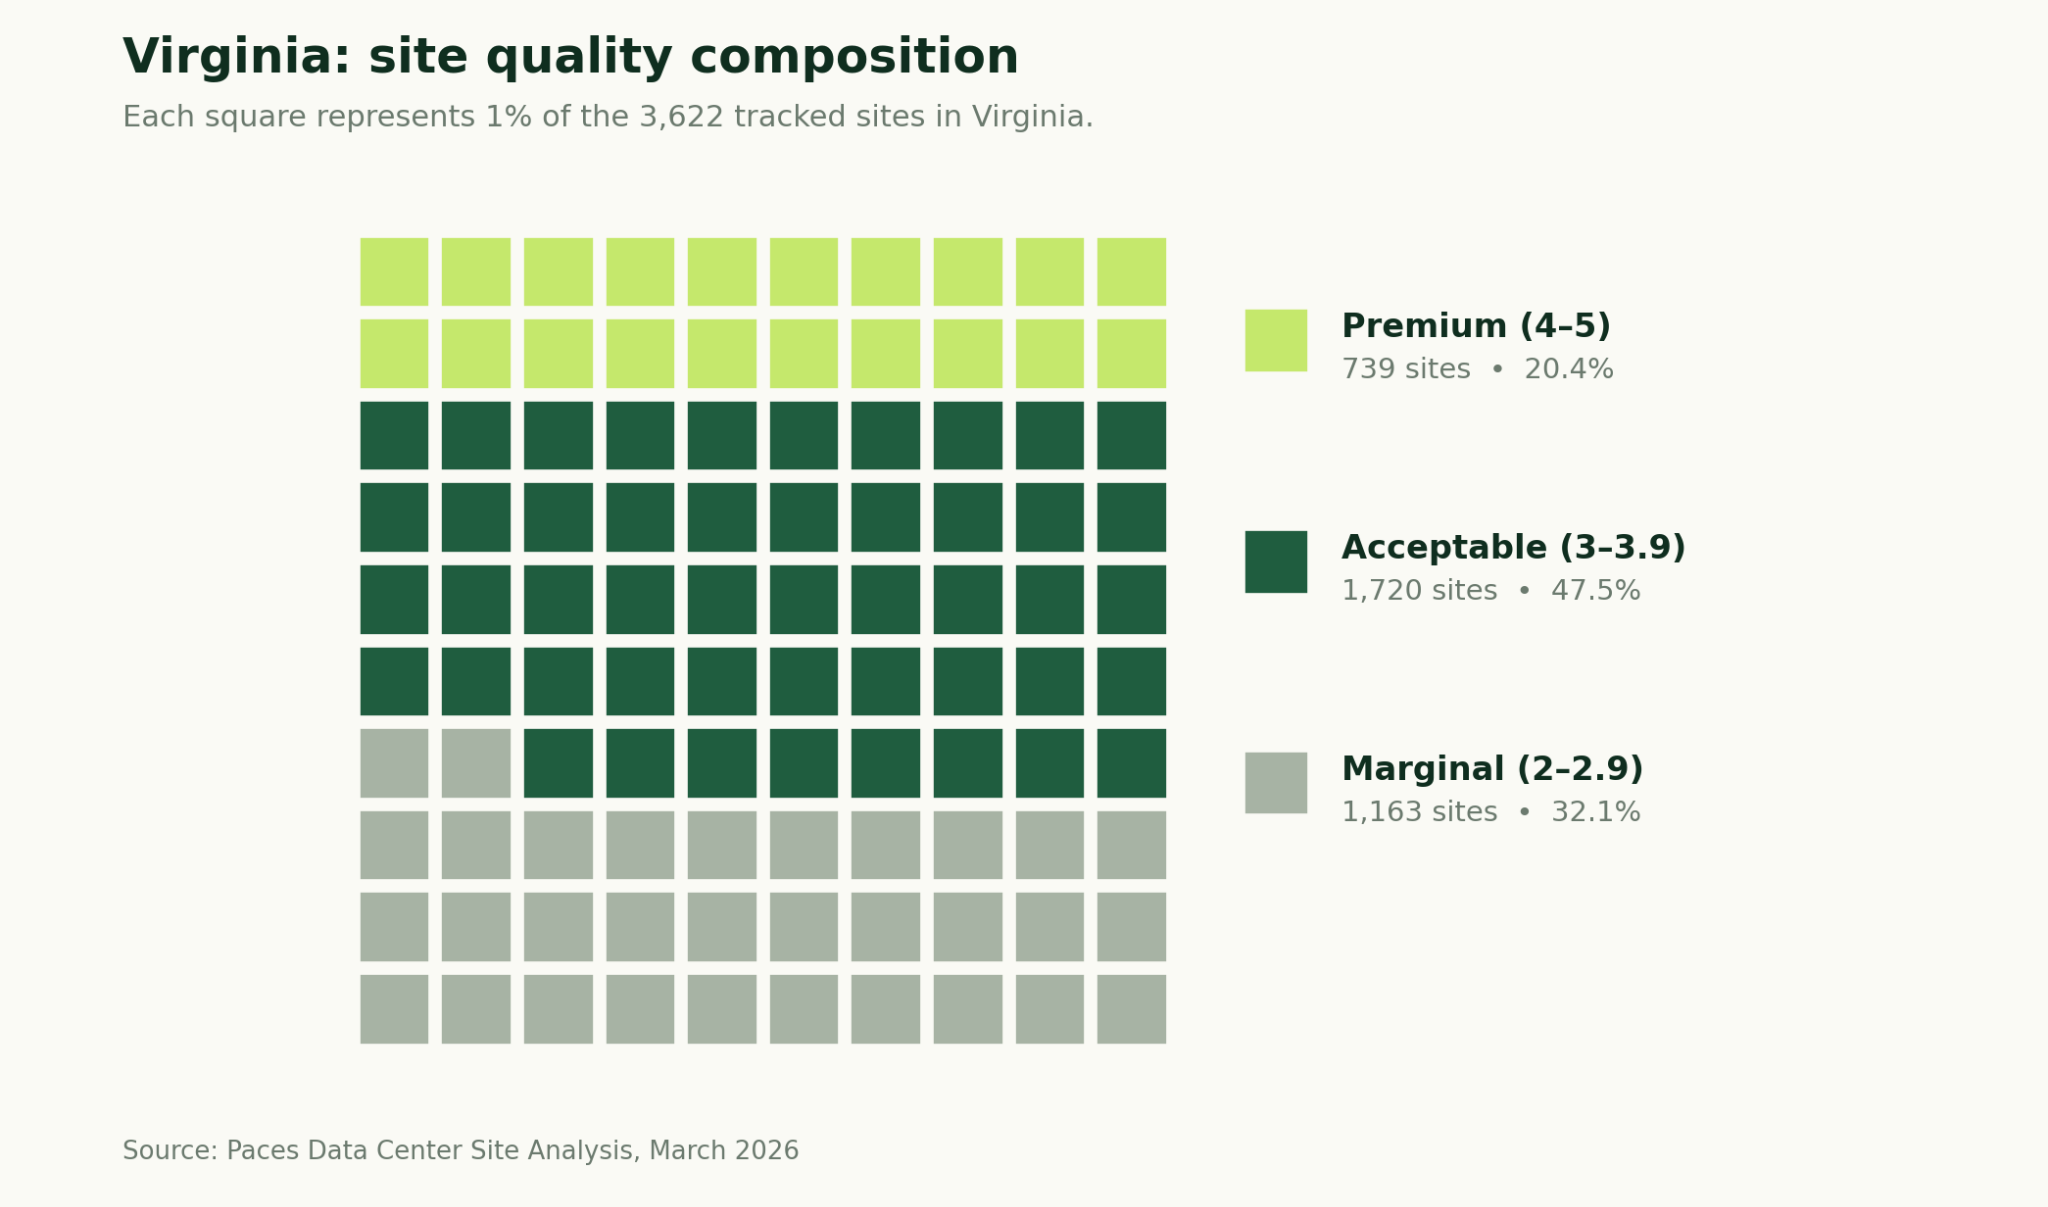
Virginia
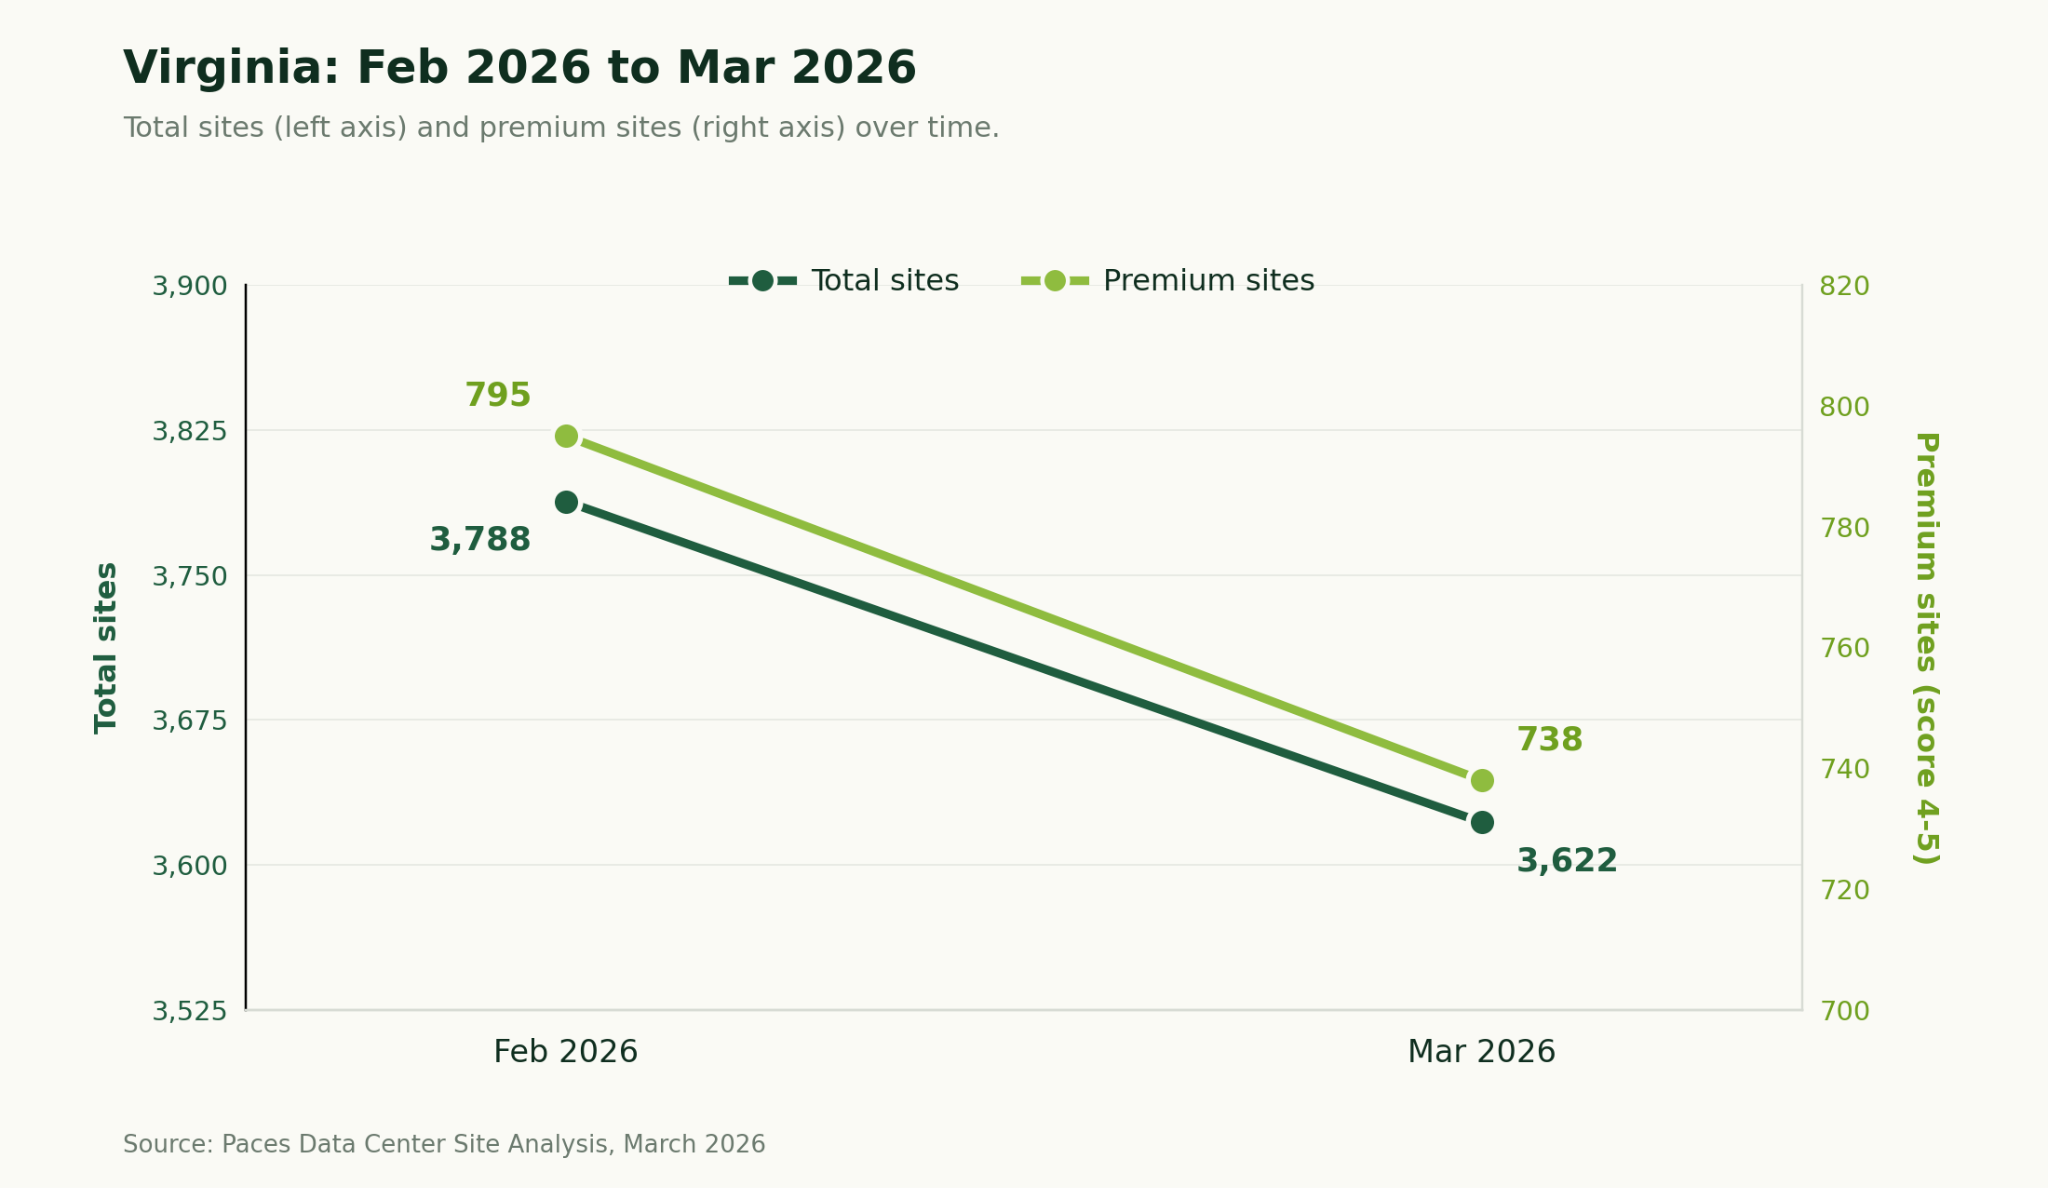
Virginia's March data shows continued inventory contraction, with total sites declining 4.4% and premium inventory falling 7.2%. Despite the premium rate slipping from 21.0% to 20.4%, Virginia is still comfortably the second-highest in the report, trailing only Texas. The state's fundamental dynamic is unchanged: scores are based on PJM RTEP25 Summer Peak 2030 projections, and Virginia's current grid remains among the most constrained in the country. Developers screening Virginia in March are looking at where capacity is expected to open up over the coming years, not where it is available today. Brunswick County's continued presence among both quality and volume leaders makes it the clearest near-term target for developers willing to engage the longer planning horizon Virginia requires.
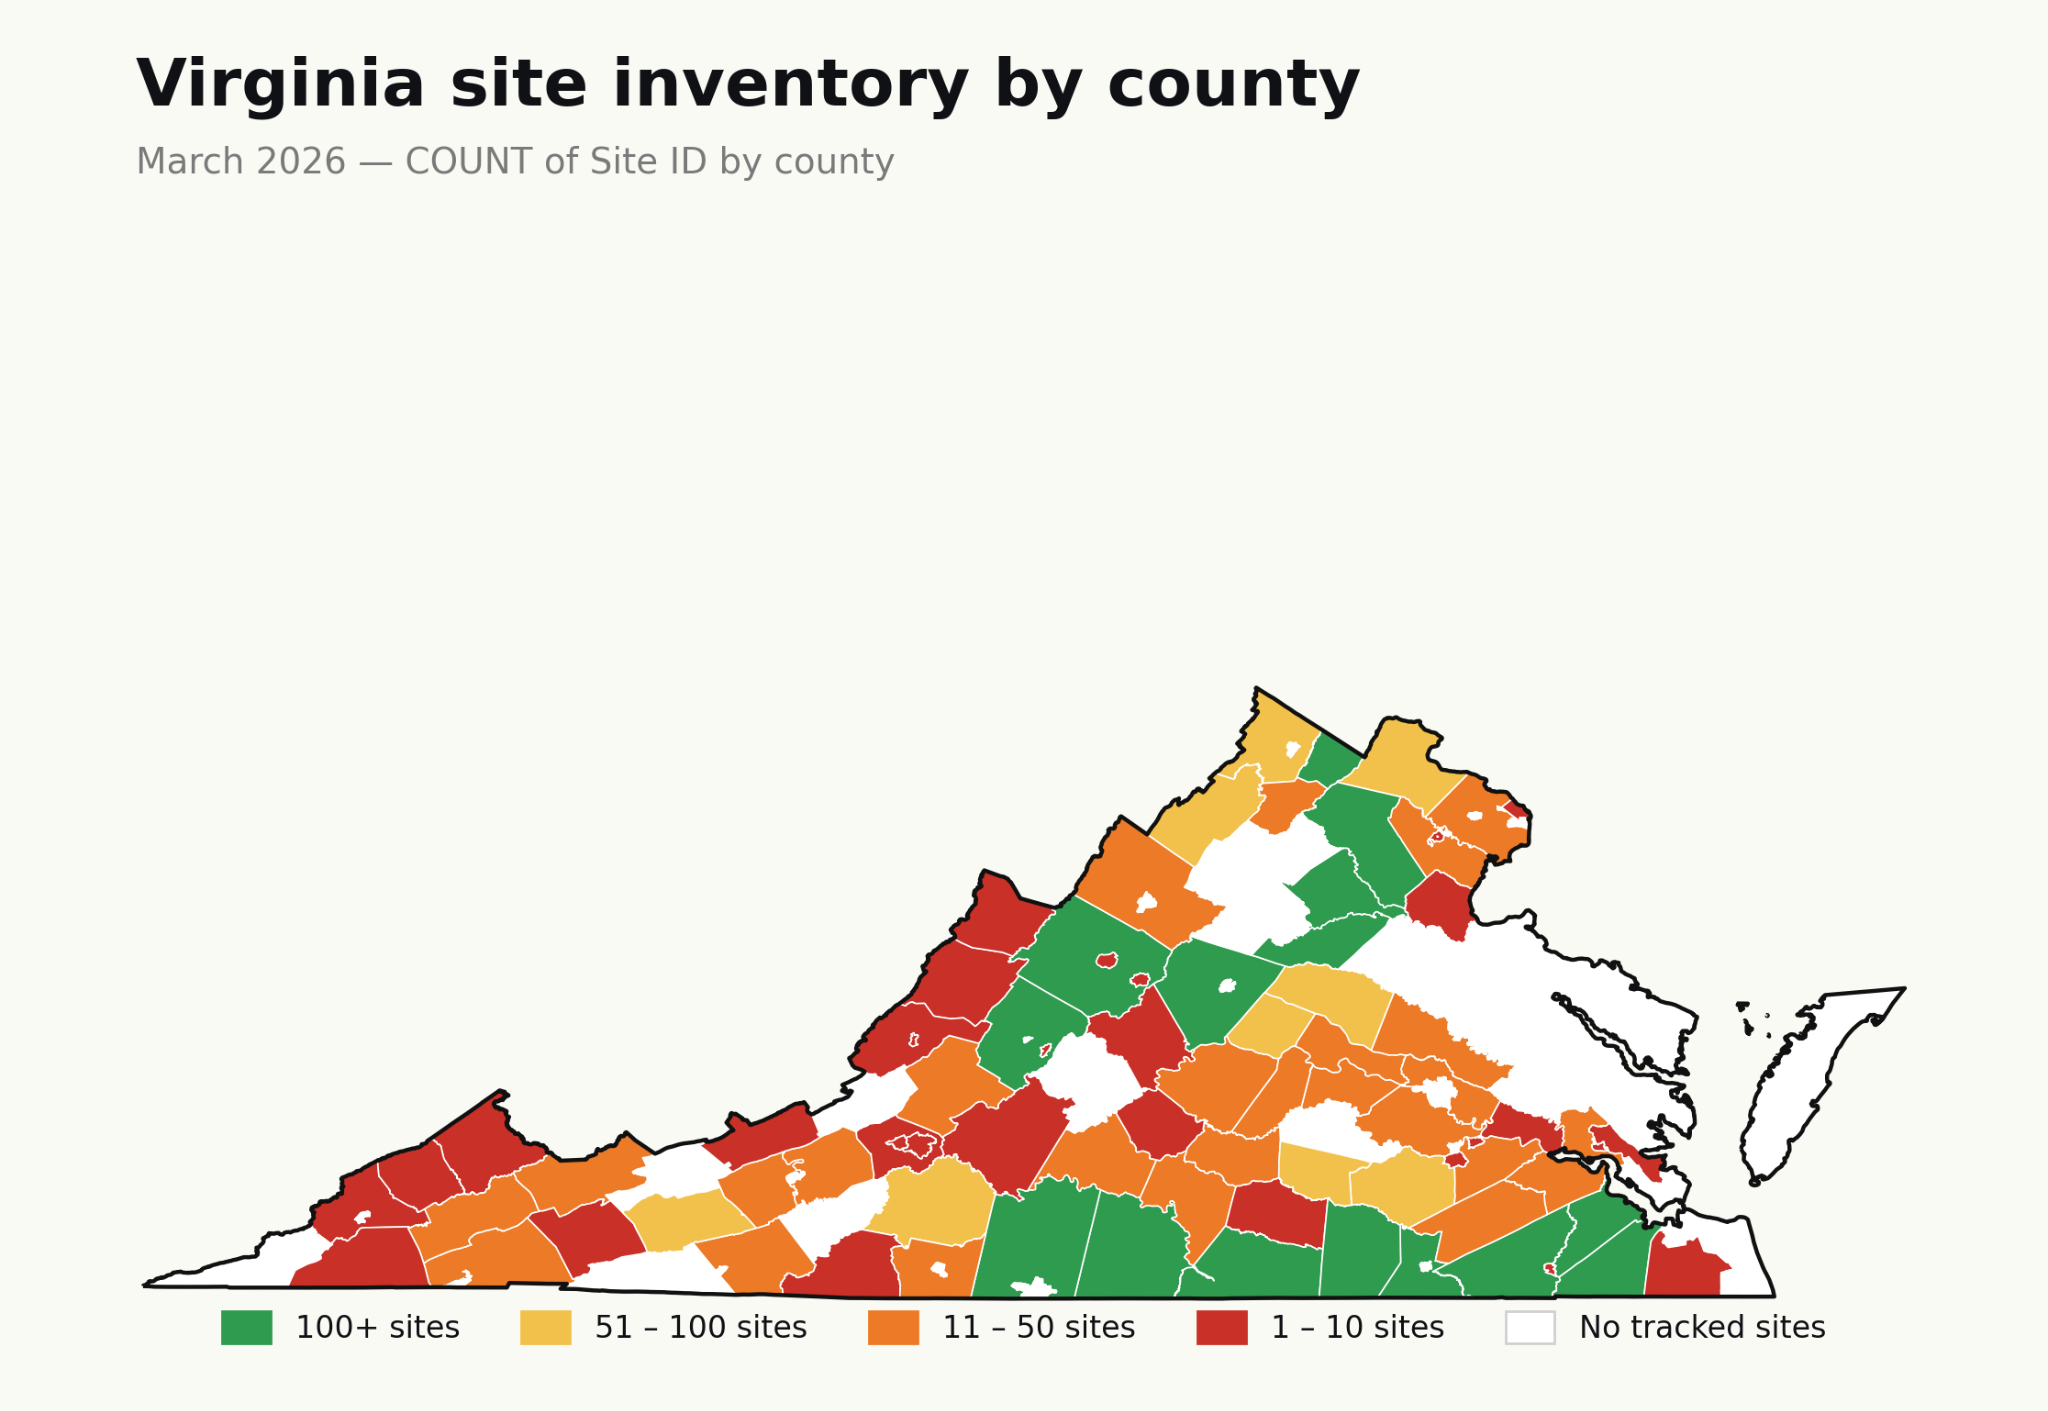
February to March: What changed
- Total sites declined from 3,788 to 3,622 (-4.4%), and premium inventory fell from 795 to 738 (-7.2%). The premium rate slipped from 21.0% to 20.4%. Virginia shows the largest premium inventory loss in absolute terms of any returning PJM state.
- Hopewell held the top spot but its average score fell from 4.7 to 4.45. York County dropped out of the top 5, replaced by Wise County (4.15, 1 site). James City (4.28), Highland (4.2), and Brunswick (4.15) retained their positions.
- Volume leadership is consistent: Mecklenburg, Southampton, Pittsylvania, Greensville, and Fauquier all retained their positions with modest site count declines. Fauquier (143 sites, avg 4.01) remains the only top-volume county at the premium threshold.
Key takeaways for Virginia
- Virginia contains 3,622 tracked sites across PJM. 20.4% of sites (738) score 4.0 or above (Premium threshold), the second-highest premium rate among all ten states.
- Hopewell leads in average site score (4.45) with 2 sites.
- Mecklenburg County leads in total site volume (243 sites, avg score 3.05).
- Brunswick County (119 sites, avg 4.15) remains the strongest combination of volume and premium quality. Fauquier County (143 sites, avg 4.01) is the only volume leader at the premium threshold.
How to stay ahead
The 35,517 sites tracked across ten states represent a snapshot, and one that will look materially different in thirty days. Pennsylvania's 7.1% inventory contraction in a single cycle, Virginia's continued premium drawdown, and Indiana's stabilization after February's sharp reset are all reminders that point-in-time site screening is insufficient for developers making real capital allocation decisions. The sites available today will not all be available next month.
County-level data is where the action is. State averages hide dramatic local variation: Texas's 33.7% premium rate means nothing if your team is screening in a county where the average sits at 3.6. Iowa's 11.7% premium rate across a 5,269-site universe still yields 615 premium sites, concentrated in a handful of counties in the southern and western portions of the state. Oklahoma's 6,335 sites are highly concentrated with Noble, Garfield, and Beaver alone account for more than 1,300 of them.
The ten states in this report represent a substantial share of current U.S. hyperscale and colocation development activity. Together they hold 35,517 sites, 5,531 of which meet the premium threshold that most serious developers use as a first filter. Iowa, Oklahoma, and North Carolina enter this edition as first-time additions; all three will have month-over-month comparison data beginning with the April report.
This analysis is one layer of a multi-layer decision. Infrastructure scores tell you where power and connectivity align. They do not tell you whether a county will permit a data center, whether community opposition will delay or block a project, or whether a competing developer has already secured the best parcels. Paces offers permitting risk analysis, community sentiment scoring, and competitive intelligence that complement this infrastructure view. Developers who layer those inputs on top of site scores are the ones closing deals, not just building pipelines.
Find the right sites faster
Subscribe to the Paces monthly newsletter to receive updated county-level site intelligence for all ten states as each cycle publishes. Ready to get to the site level and see this data across every state? Book a demo to go deeper and learn about custom screening, real-time data access, and bespoke market analysis.
Sign up for emails
Find the right sites faster, assess feasibility with world class data, and track progress across your entire project pipeline with software built to compress your workflow.