10 GW by 2030: Sizing the New York Community Solar Market from the Local Ordinance Up
Introduction
Decarbonization targets are a common and expedient method of aligning state-level energy policy into a unified front for advancing the adoption of renewable energy. New York, which consumed 141 TWh of electricity in 2021 – the fifth highest in the nation – has aggressive, nation-leading goals of reaching a 70% renewable grid by 2030 and a completely emissions-free grid by 2040.
Achieving these milestones will require deploying a variety of renewable energy assets, from offshore wind to rooftop solar. State goals dictate that distributed solar installations in particular must double from a current nameplate capacity of about 5 GW today to 10 GW by 2030 to fulfill its contribution to overall decarbonization targets. Community solar, which consists of ground-mount distributed solar projects anywhere from 1-10 MW of capacity, is expected to play a huge role in getting to 10 GW; these projects made up 70 percent of total solar installations across the state in 2021 and there is currently 2.3 GW in later stages of the development pipeline.
However, programs and incentives initiated from the highest levels of government must align with the granular patchwork of local regulations and ordinances spread throughout the state’s 1,015 townships and incorporated communities. These smaller authorities having jurisdiction (AHJs) have the final say on land use decisions and often place bespoke restrictions and guidelines on solar development that might be at odds with broader state energy goals.
When evaluating all land in upstate New York according to not only suitability from an environmental and interconnection perspective but also restrictions from local ordinances, is there enough land to build the remaining 5 GW of distributed solar capacity we need?
Community Solar Market Sizing by Assessing Zone District Permit Status
Paces conducted a bottoms-up analysis to evaluate all the feasible land for community solar within the context of local permitting restrictions. First, Paces found the 6,080 parcels of land at least 20 acres in size and located within 0.2 miles from a distribution feeder with at least 1 MW of hosting capacity as determined by the utility’s hosting capacity map. Next, Paces refined the list by removing parcels with poor “buildability” scores for ground-mount solar, or in other words, only keeping properties with at least 10 acres of continuous flat buildable area residing on cleared yet undeveloped land.
This left 4,901 unique properties and 201,964 acres roughly suitable for community solar from a buildability and interconnection perspective before taking local permitting restrictions into account. This last filtering step, which requires applying the rules and restrictions from solar ordinances and zoning codes to parcels as if they contained proposed projects, is the most subjective and tedious component of the analysis.
The most informative and straightforward restriction is the permitting status assigned to zoning districts. Oftentimes, land use planners will classify types of solar projects by size (large scale vs. rooftop) and/or purpose (accessory vs. primary use) then specify whether each class is allowed by right, allowed under special conditions, or forbidden outright by zoning district. Unfortunately, many AHJs lack solar-specific zoning codes and district maps or contain ambiguous language, making assessing permitting risk through the permit status alone difficult.
Still, to determine the permitting status for each parcel under consideration, Paces used a combination of human researchers and large language models to cross-reference zoning maps with the zoning codes and solar ordinances for every AHJ in the state where the requisite information was available. The final permit status categories were defined by whether Paces could validate community solar is prohibited or allowed in the parcel’s zoning district, whether Paces could reasonably infer community solar was prohibited or allowed, or whether the permit status was too uncertain to classify based on ambiguous language or missing data.
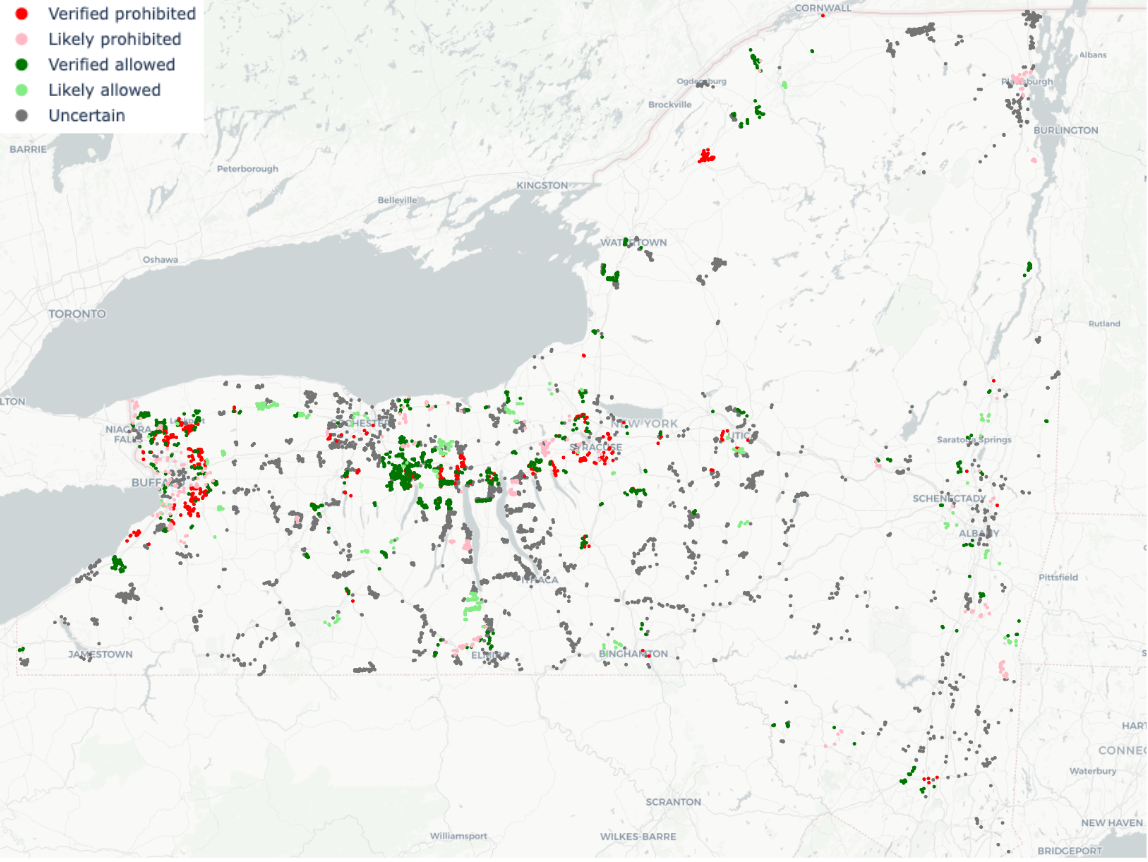
The 4,901 properties in upstate NY that are most suitable for community solar, color-coded by estimated permitting status.
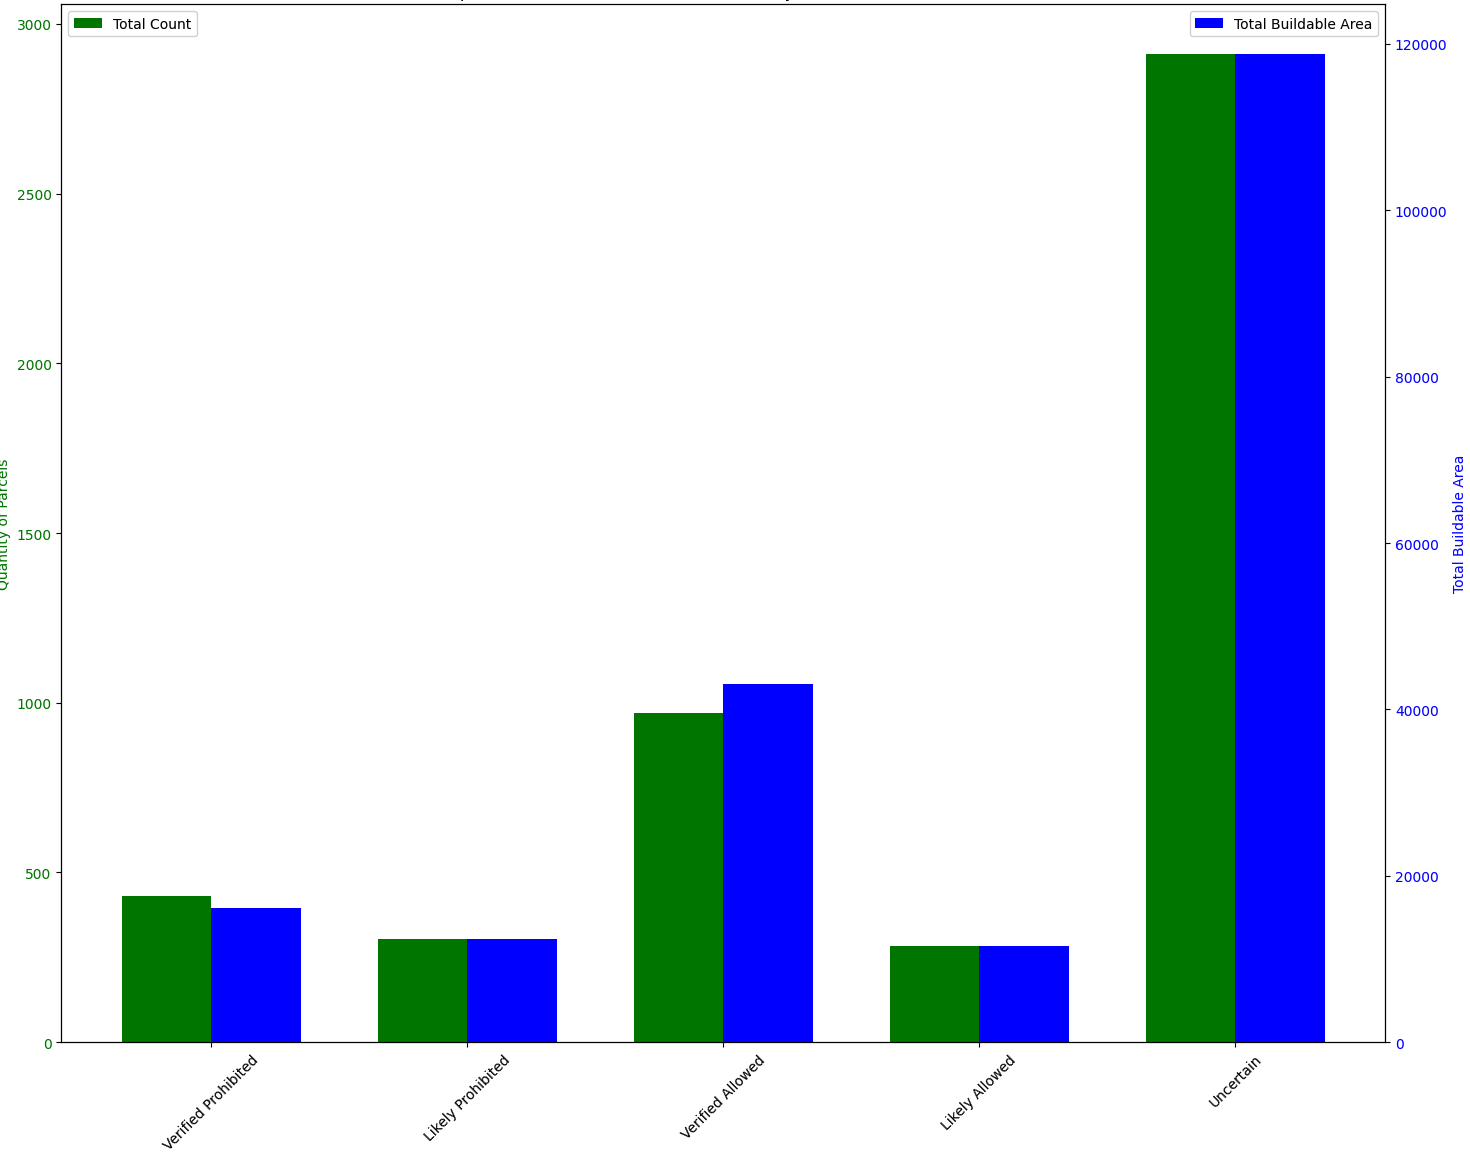
Total count of properties and total acreage of suitable community solar land classified by estimated permitting status.
The first notable takeaway is that most of the land suitable for community solar development resides in jurisdictions where the permitting status of the parcel is uncertain based on publicly available information.
The second most notable takeaway is that based on available land, building the amount of ground-mount distributed solar we need will be tight – regardless of permit status. According to NYSERDA, solar projects on agricultural land typically occupy 4-8 acres of land per MW. Assuming that 10% of the 201,964 total acres in this sample is used for solar, and that we need at least 6 acres of land per Megawatt of PV, leaves enough suitable land to accommodate 3,366 MW of solar PV without considering permitting restrictions. Removing parcels from this sample in explicitly forbidden or likely forbidden zones drops this number to 2,889 MW and exclusively considering land in zones where community solar is explicitly allowed or likely allowed drops it even further to 909 MW. Assuming all 2.3 GW of community solar in the pipeline gets built, we have enough clear-cut permitted land for just 33% of the remaining 2.7 GW of distributed solar capacity we need to hit 2030 state-level goals.
These results indicate that much of the coming growth in distributed PV must take place in AHJs currently without detailed zoning restrictions for solar. Since it is clear we will need to build in areas with uncertain zoning restrictions, predicting which AHJs will evolve favorably – and when – is of the utmost importance to understanding where to focus development efforts and determining what permitting reforms will be necessary to hit our 2030 goals.
Latent Variable Modeling for Solar “Maturity” and “Permitability”
The first step to identifying these AHJs is developing methods of quantifying the core concepts we want to measure. In our case, they are:
- Maturity: the specificity, detail, and comprehensiveness of an AHJ’s zoning code as it pertains to community solar projects.
- Permitability: the relative ease with which a developer can build a community solar project in light of the AHJ’s permitting process and zoning restrictions.
The extent of zoning and ordinance data, as well as how it is made available and to what degree of detail, creates a spectrum of “maturity” for solar development. In turn, more mature markets provide more information about how straightforward or difficult it might be to abide by the zoning regulations, providing more certainty regarding its “permitability”. This method of mapping observable features to unseen, underlying concepts is called “latent variable modeling”, and with the proper data integrations in place, it can supercharge the intuition of a highly experienced project developer and provide insight as to where new solar development will take place.
Identifying Mature Markets with Favorable Solar Ordinances
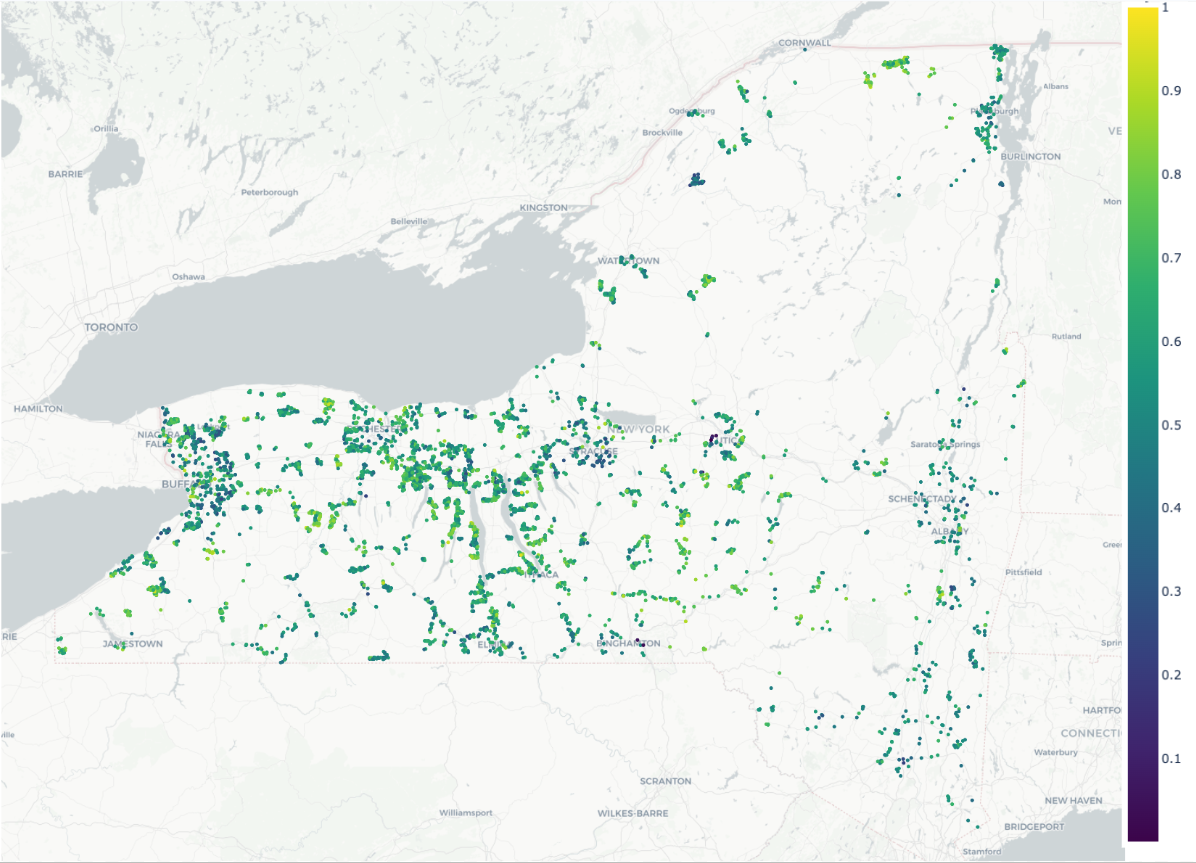
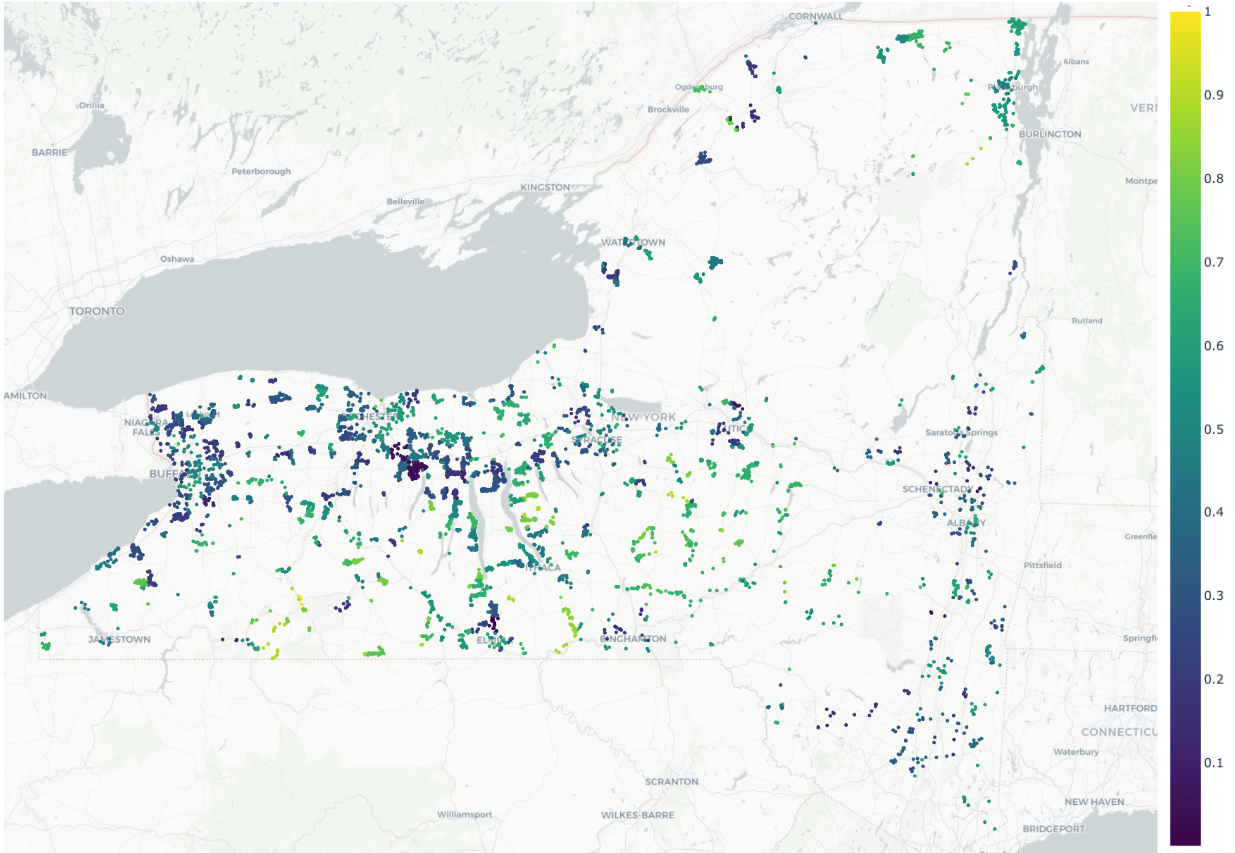
One useful way to derive insights from these latent variables is to combine them with other valuable datasets, such as historical installed capacity and queued project data, and a convincing hypothesis. For example, AHJs scoring high on solar code maturity with a severe drop-off in recently completed projects may indicate that the recently passed solar ordinance contains new stipulations that technically allow solar but have additional onerous requirements, such as complicated lot size, setbacks, and native vegetation restrictions, that make new projects impractical. On the other hand, communities scoring high on zoning maturity with continued growth in recently installed and planned projects are more likely to have workable zoning guidelines that facilitate but do not impede new community solar projects.
On the plot below, parcels with a score closer to 1 reside in mature and favorable markets whereas parcels with scores closer to 0 reside in AHJs more likely to contain impractical solar restrictions.
Developing / Early Stage Markets on the Verge of Writing Their First Ordinance
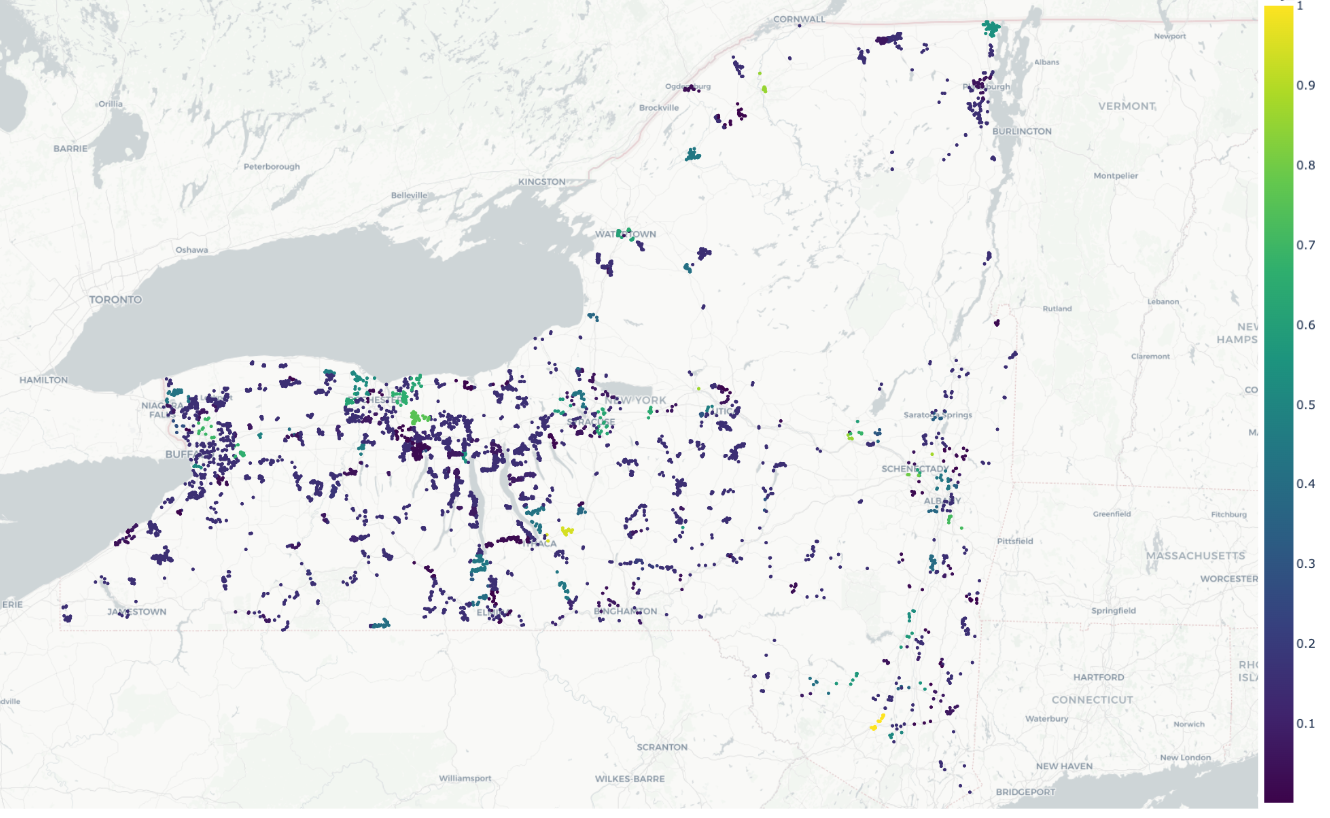
The latent variables can also be used to identify AHJs that may be on the verge of adding to their solar code or creating one for the first time. For this metric, Paces identified all the AHJs with low maturity (early in their zoning code evolution) and high recent growth (many newly installed projects or projects in the queue) with the hypothesis that AHJs seeing their first influx of solar development are more likely to pass a solar moratorium or write a new, solar-specific ordinance. In the visualization below, parcels closer to 1 reside in AHJs with a higher likelihood of an upcoming change in legislation.
Future Analysis
The final step involves not only predicting when but also how a community is likely to change their zoning code and whether that change will be favorable or unfavorable to community solar development. This requires expanding the scope of analysis by using the zoning maps to understand land use patterns and differentiating between agricultural and industrial communities; incorporating demographic data to differentiate between the old from the young populations and the homesteading communities from seasonal vacationers; economic indicators to determine which communities might be more receptive to alternative income streams and bill credits from a solar project; and political data to account for voting tendencies. With a robust mapping of similarity between communities along these dimensions, we have more confidence in predicting their evolutionary path by matching a given low-maturity AHJ with their best representative from the collection of high-maturity AHJs.
Conclusion
Quantifying latent variables and comparing AHJ attributes is the first step towards a true bottoms-up permitting risk model that can inform state-level policy, provide an important new and highly granular input into high-level grid planning, and help project developers find the areas most suitable for community solar. Despite simplifying assumptions that will be refined over time as new data sources are processed and integrated, this analysis provides practical recommendations for developers regarding mature markets to avoid, mature markets with friendly permitting regimes, and emerging markets that are likely on the verge of modifying their zoning code.
Sign up for emails
Find the right sites faster, assess feasibility with world class data, and track progress across your entire project pipeline with software built to compress your workflow.