Evolution at the Edge: Renewables and the Spatial Configuration of the Grid
Fully decarbonizing the electricity grid will require installing renewables where they are most cost effective. In practice, this translates to vast amounts of panels in the deserts of the Southwest and turbines dotting the blustery Midwest. In many regions we’ve already made great progress; states like California and Texas seem to set records for wind and solar production every year. With so many new types of generating resources coming online, how is the topology of the electricity grid – the spatial configuration of power lines, substations, and other components of the transmission system – evolving in response?
In comparison to legacy generation resources such as coal, gas, and nuclear power plants, renewable resources like wind and solar tend to be built on the periphery of metropolitan areas, where there is enough land available to accommodate turbines and panels. And because we need to extend the grid out to where the renewable generation is, it would make sense that many wind and solar developers build dedicated, tie-in transmission lines (spokes) to connect to the grid whereas traditional forms of generation occupy relatively centralized junctures in the network (hubs).
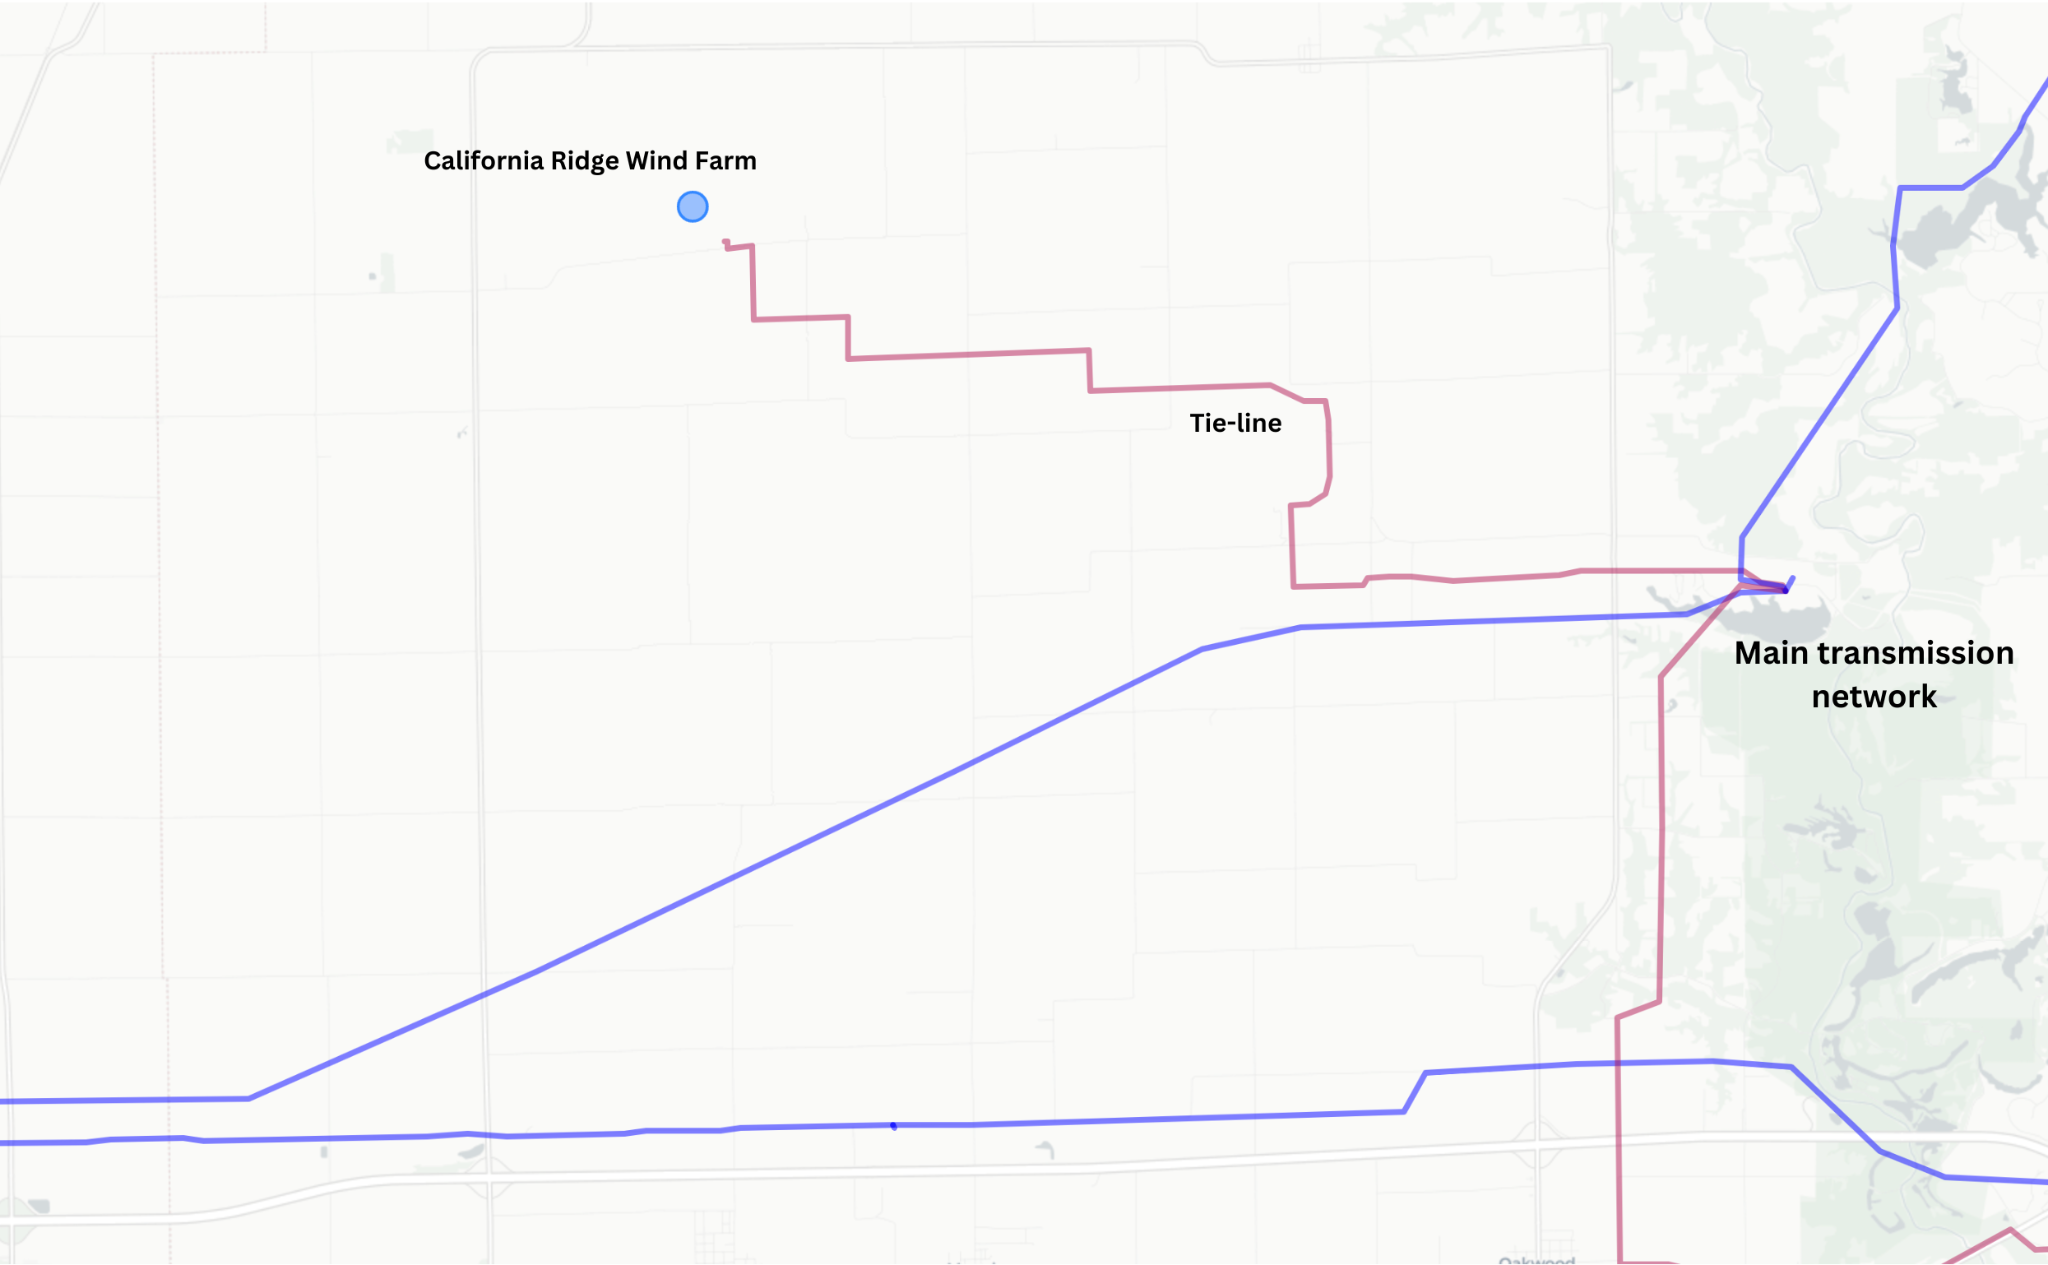
The California Ridge wind farm, a 134-turbine wind farm in eastern Illinois. It is connected to the bulk grid via a tie-in transmission line.
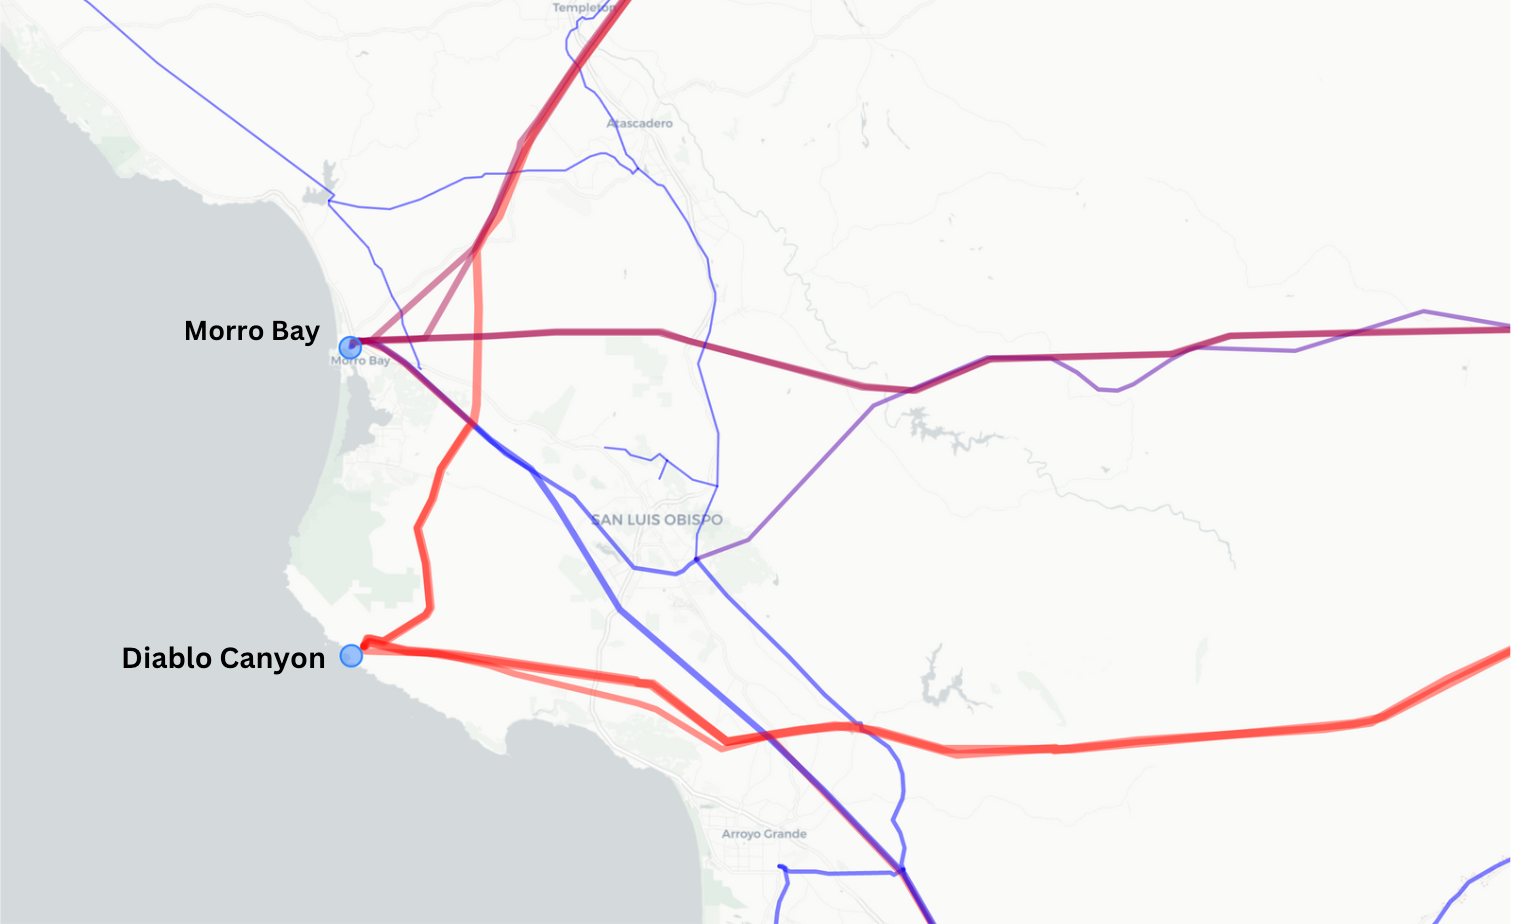
The nearly-retired Diablo Canyon nuclear plant (bottom) and retired Morro Bay natural gas power plant (top) in California, which occupy centralized nodes in the transmission network.
Common sense and pertinent examples, such as the California Ridge wind farm and Diablo Canyon nuclear plant shown above, support this network topology hypothesis. But when considering every power plant in the U.S., does the data back it up?
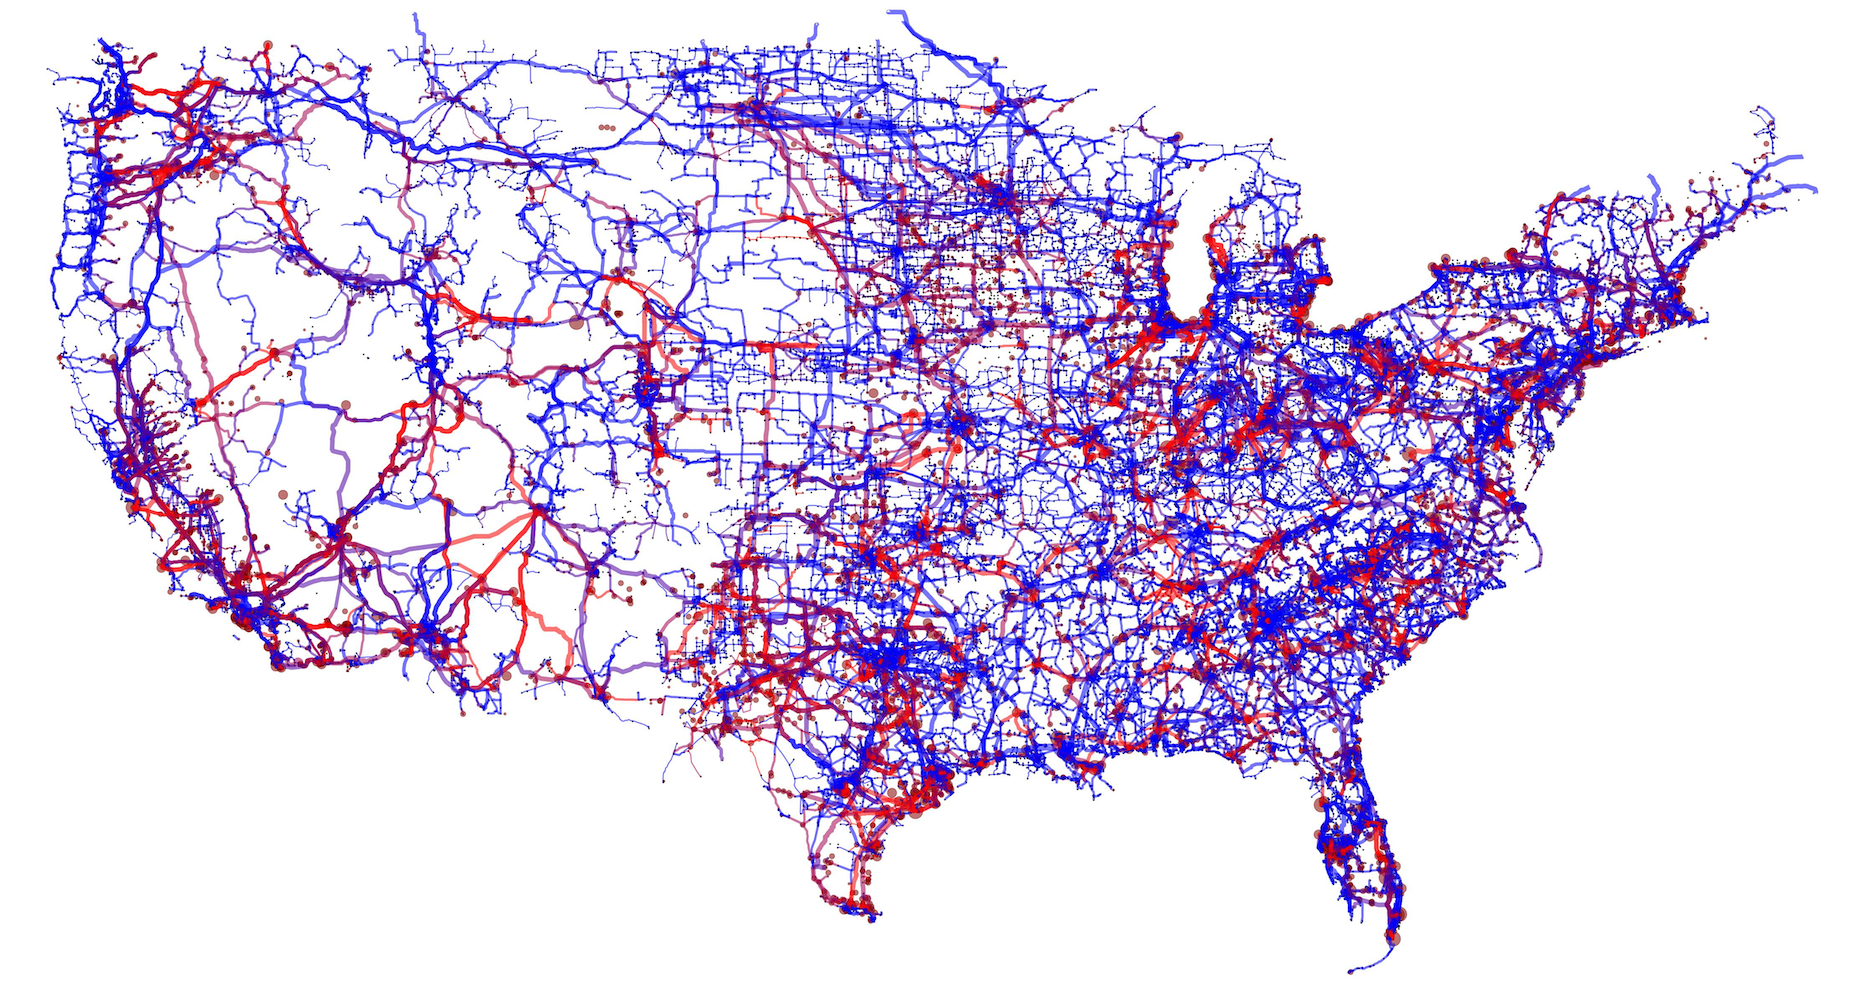
Last month, Paces linked each planned, operational, and retired power plant within the contiguous U.S to specific circuits in our transmission dataset in order to illustrate the relative density of generation capacity on the transmission network and identify the most “crowded” lines. This also enabled us to test the aforementioned hypothesis by evaluating how transmission topology near power plants varies not only by generation type, but by nameplate capacity, installation year, and balancing authority.
To make these comparisons, Paces used geospatial distance and string matching to match power plants with their closest line and substation then counted the transmission line segments within its circuit. For the purposes of this research, a transmission circuit consists of one or more line segments connected to two or more substations; lines connected by taps are considered parts of the same circuit, so the power plant establishes its “reach” on the grid by crawling through the nearby network and stopping when it encounters new substations. For example, the red lines in each example shown above illustrate all transmission lines the power plant is directly connected to, before it reaches another substation. By counting these lines for each power plant, we can approximate the degree to which a power plant acts as a “spoke” or “hub” in the overall network.
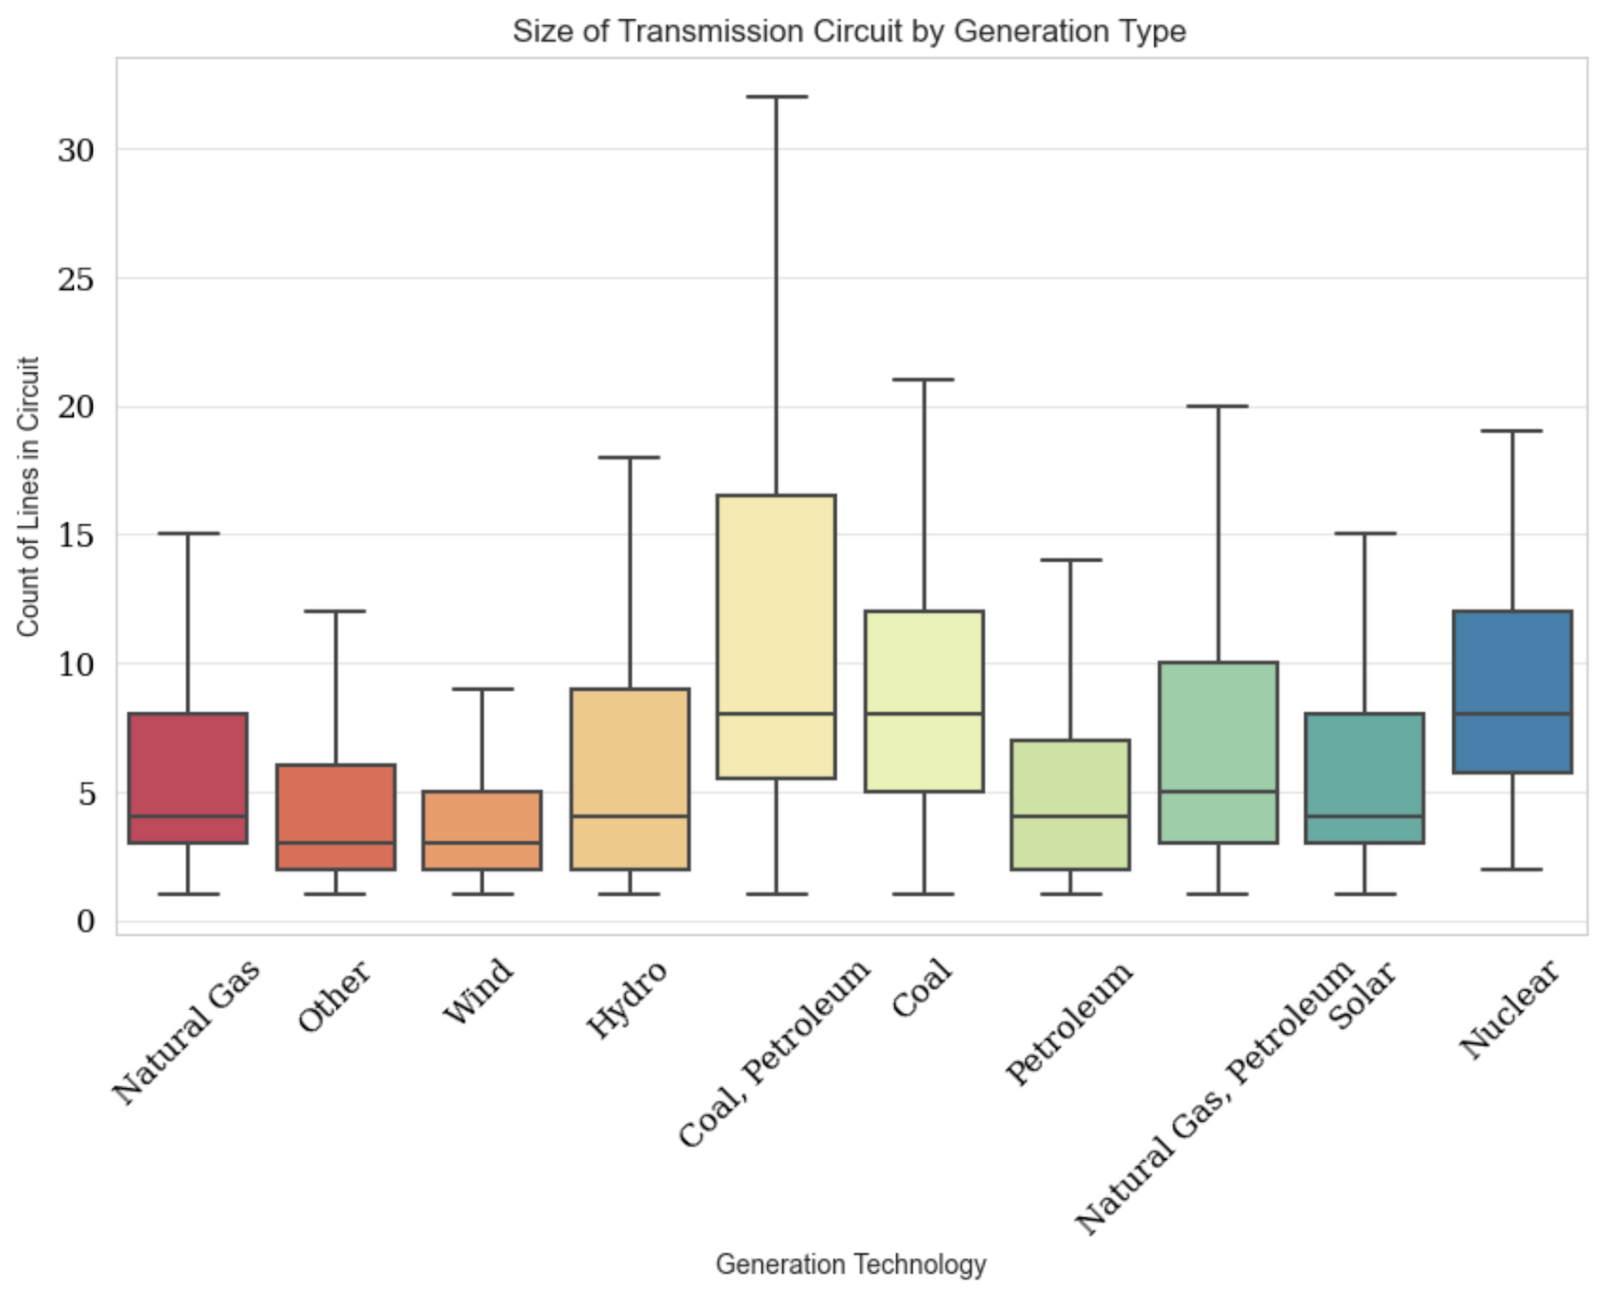
There is a slight association between generation type and transmission circuit size (as measured by number of lines), with traditional thermal resources (fossil fuels, nuclear) having larger circuit sizes than renewables (wind, solar).
The data suggests wind and solar have a slight spoke-tendency. However, generation type could be a proxy for other confounding factors: perhaps traditional resources are simply larger, as measured by nameplate capacity, and require greater network access to deliver larger quantities of power?
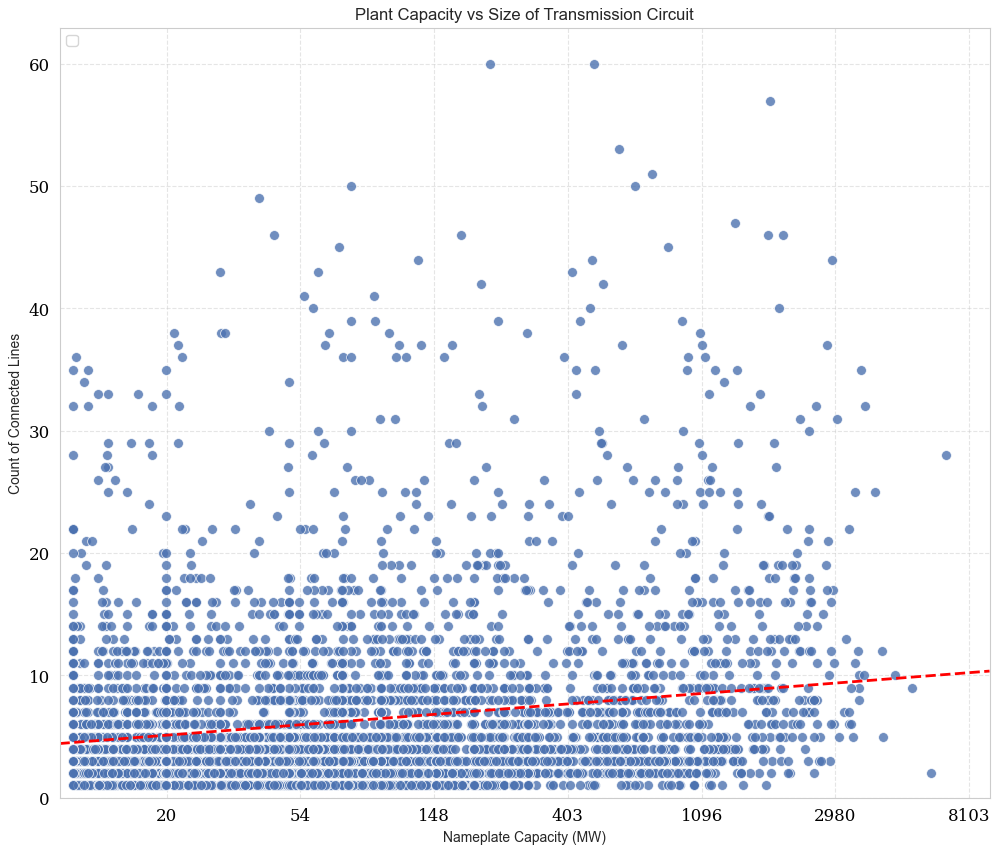
Nameplate capacity and transmission circuit size show a slight positive correlation (actual value is ~0.183).
The data shows a slight positive correlation between transmission circuit size and nameplate capacity, suggesting that larger power plants have greater network access.
Another hypothesis is that it was easier to build transmission lines around older power plants. If this is the case, we would expect a negative correlation between operating date and circuit size.

Operating date and transmission circuit size show a slight negative correlation (actual value is ~0.177).
A final plausible hypothesis is that network topology depends on who governs the grid; in other words, utilities have different preferences for how to connect power plants to their transmission grids.
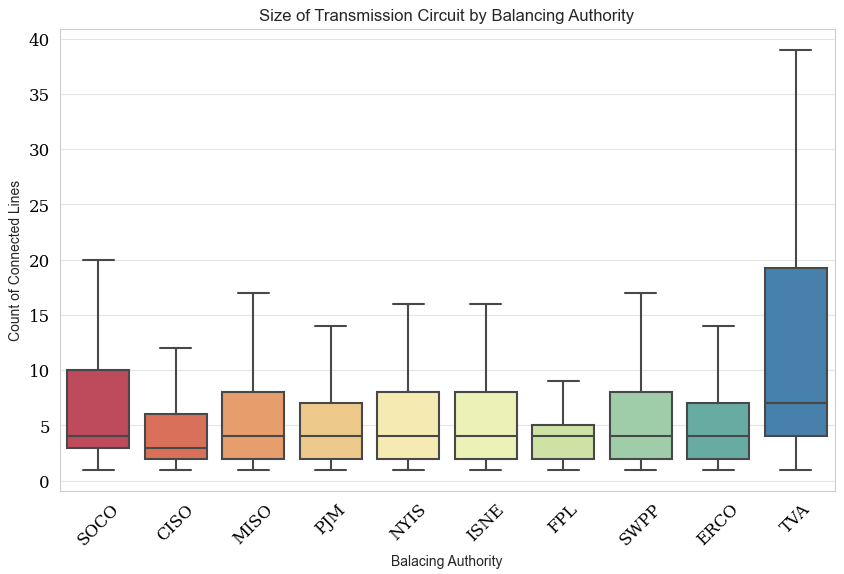
There is a slight association between balancing authority (BA) and the size (in number of lines) of power plant transmission circuits, with some BAs (SOCO, TVA) having relatively centralized networks compared to other territories.
The factors driving network topology are complex and interrelated and results from this high level research cannot support definitive conclusions without further analysis. However, the data does suggest that large, old, and conventional power plants tend to be connected to larger transmission circuits, as measured by the quantity of lines in the circuit. In other words, they are more likely to be “hubs”. Renewable resources, which may also tend to be smaller and more recently developed, are more likely to be “spokes”. The results of this analysis softly confirms the narrative that recent transmission line development seems to be appending infrastructure to the existing system rather than restructuring the network around new concentrated areas of generation capacity.
If you have questions about the methodology used in this analysis or any suggestions on how to improve the research, please don’t hesitate to contact Kyle Baranko at kyle@paces.com.
Sign up for emails
Find the right sites faster, assess feasibility with world class data, and track progress across your entire project pipeline with software built to compress your workflow.